Introduction
The Crop Manager and Analyze applications provide growers an overview of soil moisture conditions in their fields and a tool to manage irrigation operations. For a more detailed discussion of these applications, refer to Crop Manager — a Detailed Guide and Monitoring Soil Moisture for Optimal Crop Growth as well as the other articles and videos listed in the 'Links' section at the end of the article.
Key Definitions
The following definitions will aid you to realize the full capabilities of your Observant Global software platform.
|
Term |
Definition |
|
Snapshot View |
The landing page for the Crop Manager Application. |
|
Analyze View |
The page in the Crop Manager Application, where one can view data from multiple sensors on the same graph. |
|
Root Zone Weighted Average |
The average value of a soil moisture probe’s readings for each of its sensors, which can be adjusted to give particular emphasis to individual values reported from distinct levels of a plant’s root zone. |
|
Root Zone (Weighted) Sum |
A summed value of a soil moisture probe’s readings for each of its sensors, which can be adjusted to give particular emphasis to individual values reported from distinct levels of a plant’s root zone. |
|
Root Zone Summary |
A single plotted line of the Root Zone Weighted Average (or Root Zone Sum) of the soil moisture sensor values at various depths for any given time. |
|
Root Zone Summary Chart |
Chart with Root Zone Summary plotted line and management levels. |
|
Moisture Units |
The uncalibrated readings from the various individual sensors throughout the length of a soil moisture probe. These are abstract units, which are only used to provide information on relative changes in soil moisture. It is these raw values, produced at different levels of the root zone, which are used to calculate a user-adjusted, Root Zone Weighted Average that is graphed as the Root-Zone-Summary line of Root Zone Summary chart. |
|
Management Lines |
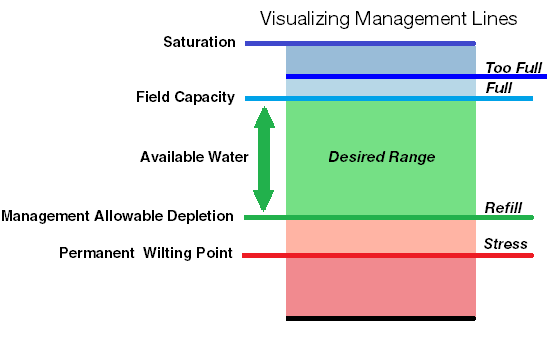
The four, user-defined levels of Moisture Units, which determine the placement and width of the five color bands on a Root Zone Summary chart. These four Management Lines allow growers to define five color-coded bands for any Root Zone Summary chart. These chart colors represent different soil moisture states as follows: |
|
Management Status |
The percent (%) value that is displayed on the hover for the map dots and next to the bar icons in the Snapshot View. The Management Status numerically indicates where the most recent value of the Root Zone Summary fell relative to the user-defined green band. The bottom Management Line of the green band is set at 0%; the top Management Line is set at 100%. As it is possible for the Root Zone Summary to move above and below the green band, the values for the Management Status Percentage can be less than 0% and greater than 100% implying plant stress for a negative value, and waterlogging or saturation for values greater than 100%. |
|
Management Status Color |
The color of the map’s dots and their corresponding bar icons, as seen in the Snapshot View. Color status is based on the color of the band in which the most recent value of the Root Zone Summary is located. |
Crop Manager Application
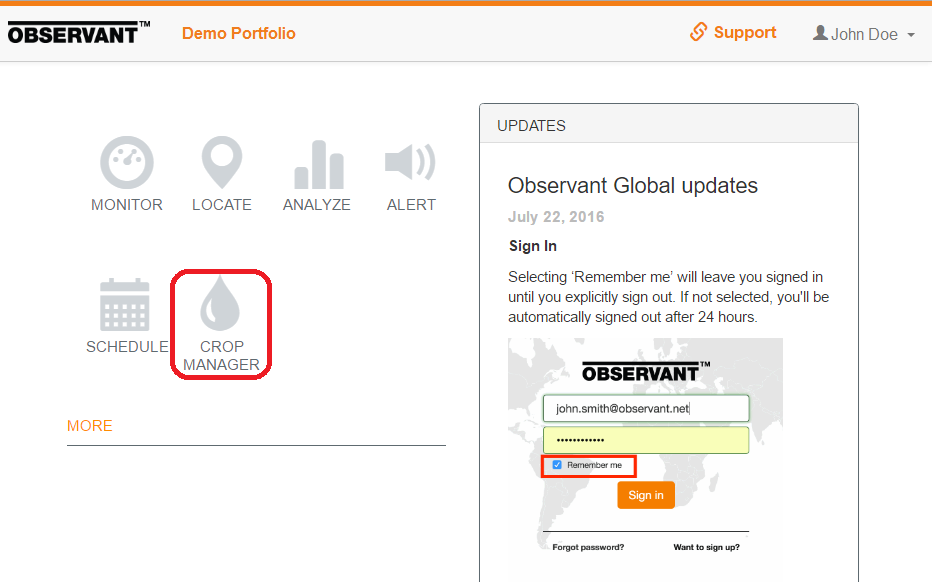
You can access the Crop Manager Application by clicking the Crop Manager icon on Observant Global’s welcome page, as highlighted in the screenshot below.
Snapshot View
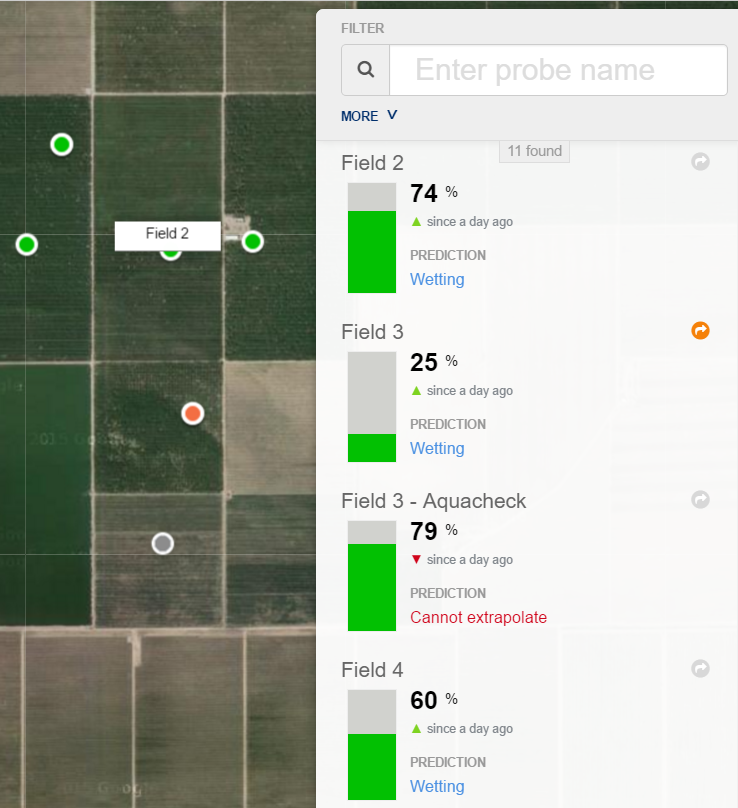
When you first open the Crop Manager Application, you see the Snapshot View of current soil moisture status for all monitored locations, as illustrated in this partial screenshot:
Color Status
The color-coded status visually reflects the current status of the Root Zone Summary in comparison to four, user-defined management levels. The resulting colored bands represent different soil moisture states as described below.
Management Status
The percentages shown for each monitored location in the Snapshot View above represent the 'Management Status' of each site's soil moisture. These percentages are relative to the upper and lower boundaries, which define the green, or 'Normal,' region of the chart. Ideally, this green band corresponds to a range of soil moisture that is readily available to (and easily used by) the crop. The bottom of the green band (ie, the 'Refill' Management Line) has a Management Status of 0%, while the top boundary (ie, 'Full' Management Line) is, by definition, 100%.
Root Zone Summary
The Root Zone Summary is a single plotted line (available in either the Analyze or Crop Manager applications) representing the weighted average (or sum) of selected soil moisture sensor values, from various depths, at any given time.
Root Zone Summary Chart
Click on a site name (eg, 'Field 2') in the right hand column of the Crop Manager landing page to see a chart of its Management Status values plotted over time.

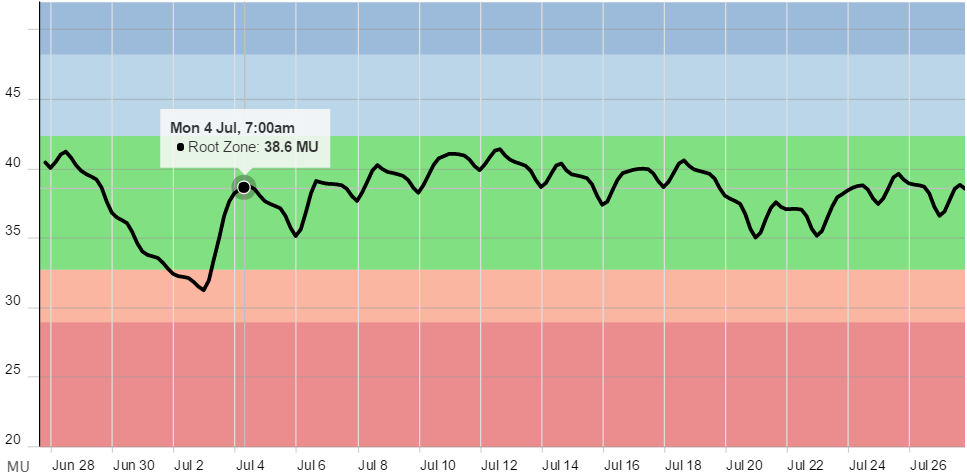
Here, you see the single plotted line of (in this case) a weighted average of all the selected sensors of a single soil moisture probe over a time span of three months.
A Management Status value of 74% for Field 2 means the value of Root Zone Summary (ie, the weighted average of the most recent soil-moisture readings) is at 74% of the distance from the bottom to the top of the green band of the Root Zone Summary Chart.
The screenshot below represents this Management Status plotted on a 30-day Root Zone Summary chart. Note that instead of percentages, however, the Y-axis units are arbitrary 'Moisture Units' (MU), resulting from the raw, unmanipulated output of this site's soil sensor.
The various management levels are adjusted to increasingly appropriate settings by observing soil moisture in the field over several irrigation cycles (possibly by the 'hand-feel' method) while using Crop Manager to observe the changing plot of the Root Zone Summary.
The shape of this Root Zone Summary allows growers to infer various soil characteristics, such as water holding capacity, field capacity, and stress point. For example, a decrease in the “stair height” over time could indicate the onset of stress.
Once the user-defined management levels have been set, the Root Zone Summary chart gives a simple visual indication of how soil moisture amounts trend relative to those levels. This relative trending provides valuable data for making appropriate irrigation decisions.
For an in-depth discussion of setting Management Lines see 'Management Lines' in the Using Soil Moisture to Make Irrigation Decisions section of the Help Desk article, Monitoring Soil Moisture for Optimal Crop Growth. Observant's Approach to the Display of Soil Moisture Data is also an excellent article on this subject.
Predicted Refill Date
The refill date is an estimated date for a refill based on the depletion rate in the past 24, 48, or 72 hours. The depletion rate is determined by applying linear regression analysis to the Root Zone Summary values within the selected timeframe. The refill date indicates when the Root Zone Summary value will reach the lower level of the “normal” green-colored band. The rate will vary depending on weather conditions and other factors.
Zoom

Using the lower zoom panel, you can readjust the time span of the upper, main chart to display any segment of particular interest. You can also zoom in by selecting an area in the main chart.
Filters
At the top of the right-hand column of the Crop Manager landing page, click on MORE to access the various filters.
Growers can use these system-defined filters to quickly find monitored locations whose root zone summary falls in a region with a particular color status or sites with the following additional statuses:
- UNCONFIGURED
The management levels have not been defined. - ERRORS
Soil moisture probes with detected issues (e.g., cabling issues, sensor’s failure). - INACTIVE
Locations with decommissioned soil moisture probes that have historical data.
To return to the initial time range, simply click on the “Reset zoom” button in the upper right of the screen.
Options Menu
![]()
Click on the tool icon in the upper right to access the following options:
- Configure management levels option allows growers to set the position of the four Management Lines, thus defining the five, color-coded bands and their associated management levels.
- Configure root zone settings option allows growers to customize the Root Zone Summary calculation. Growers can change weights applied to each monitored soil depth to allow measurements at certain depths to be more or less influential in making irrigation decisions. By default, equal weights are assigned to all monitored soil depths for any given soil moisture probe.
- Deactivate probe option allows growers to deactivate a probe at the end of a growing season or to move it to a different site.
- Print chart option allows growers to generate a printer-friendly view of the Root Zone Summary chart for printing.
- Four options allowing user-added notes to be displayed in a variety of different ways.
Analyze Application
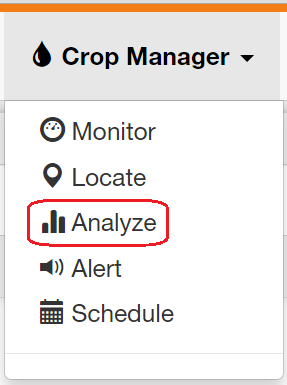
The Analyze Application is a visual tool for making irrigation decisions. Unlike Crop Manager, it allows the graphing of data from multiple sensors in a single site or sensors selected from different sites in the same portfolio. To access it click on 'Crop Manager' in the upper bar and select 'Analyze'
Here, we see a one month period (from earlier in the year) comparing the rise in soil moisture with the line pressure in part of the irrigation system.
Location Menu
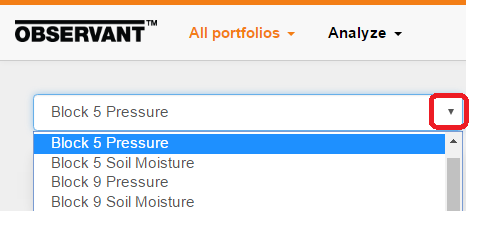
The location drop-down menu provides the ability to compare sensor readings from more than one site in a particular portfolio.
Plotted Line On/Off
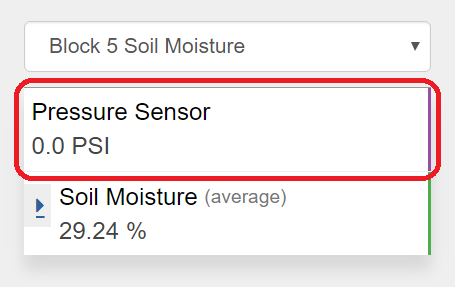
Once a site has been selected by clicking on this area, you can toggle on and off different sensors' plot lines on the chart. For example, as seen above, you can view a graph of both soil moisture and line pressure. By default, only the soil moisture (ie, 'Root Zone Summary') line is displayed initially.
Date Range

The date range menu allows growers to select predefined time spans (ranging from 7 days to 12 months) for displaying the Root Zone Summary in the chart. As with the Crop Manager application's graphs, you can expand an area of an Analyze application's Root Zone Summary chart by simply clicking on a corner and dragging the highlighted rectangle around the region of interest.
Links
Articles
- Observant's Approach to the Display of Soil Moisture Data
- Monitoring Soil Moisture for Optimal Crop Growth
- Selecting Soil Moisture Monitoring Devices
- Limiting a chart's moisture range in Crop Manager
- Crop Manager — a Detailed Guide
Videos

