
Start with the Monitor Cards
The Monitor Application presents its data in a series of cards, which display values from sensors in related groupings. Here, for example, is the Monitor Card of a Davis weather station.
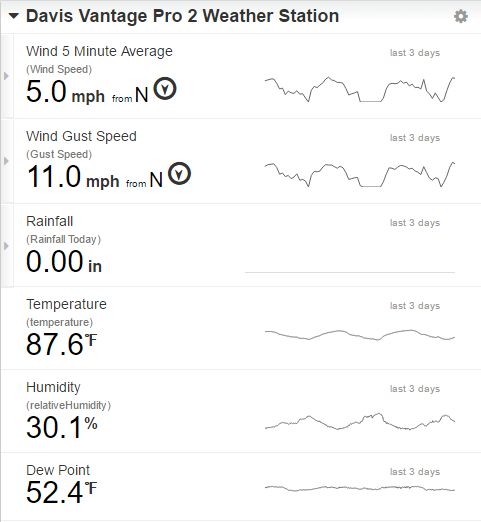
While the value for Humidity is fixed as a percentage, you may choose different units of measure for each of the other sensors shown here.
Note that, while the bottom three items are single measures, the top three groups may be expanded, showing multiple measurements. Let’s deal with the two of the single measurement items (Temperature and Dew Point) first.
Modifying the Temperature Charts
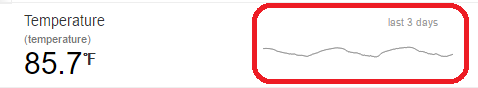
Clicking on the small ‘sparkline’ graph in the Temperature section,
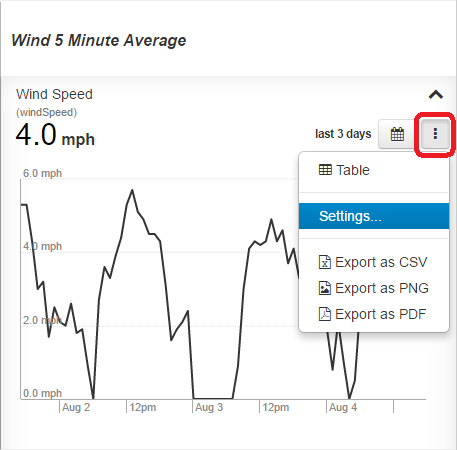
drops down a detailed graph with a menu button in the upper right corner.
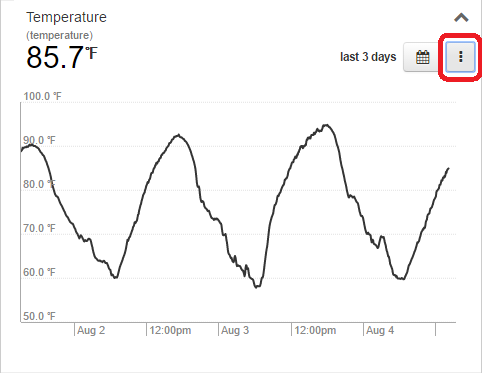
Click on that and select select the ‘Settings...’ option.
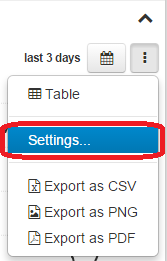
Choosing ‘Settings…’ provides a screen in which each of the following aspects of this Monitor Card’s temperature graph can be modified:
- the chart’s title and/or sub-title,
- Fahrenheit or Celsius units of measure,
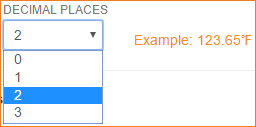
- the number of decimal places displayed and
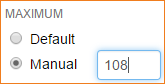
- the minimum and maximum levels of the chart’s y axis.
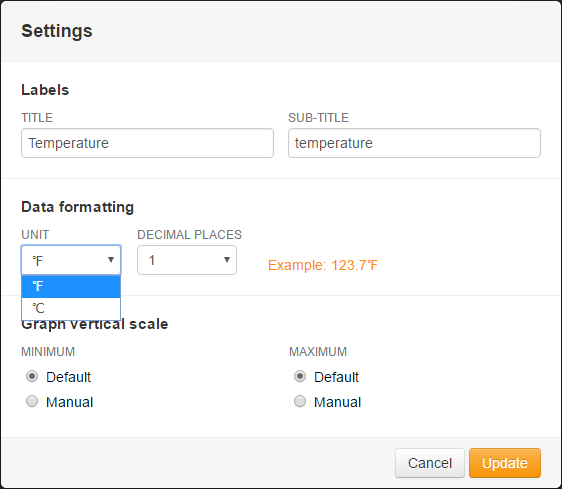
Both 'UNITS' and 'DECIMAL PLACES' are chosen from drop down menus, but the minima and maxima are numerical entries.
The graph for dew point temperature may be modified in exactly the same way as the air temperature graph.
Since, on Monitor Card graphs, relative humidity is always expressed as a percentage, its settings screen has the ‘UNIT’ section is grayed out.
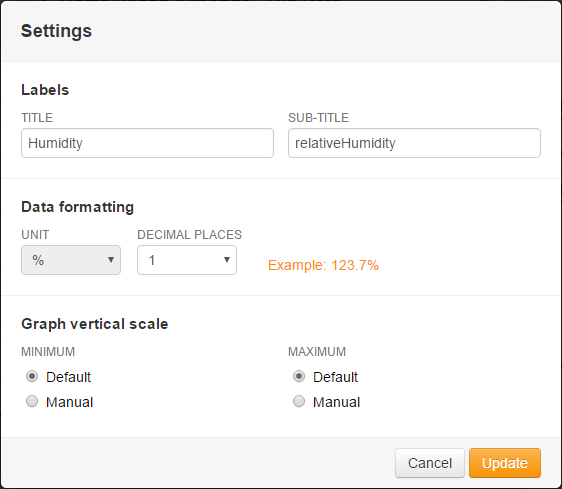
All the other chart settings may be altered just as in the above air-temperature procedure.
Windspeed and Rainfall Total
The wind and rainfall both have more than one item being measured, so you will need to first click on the small triangle (►) on the left edge of the Monitor Card to expand their sections.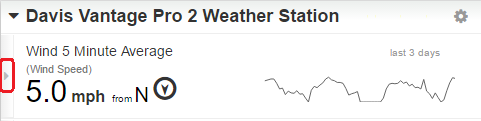
Here we’ve expanded the average wind speed section.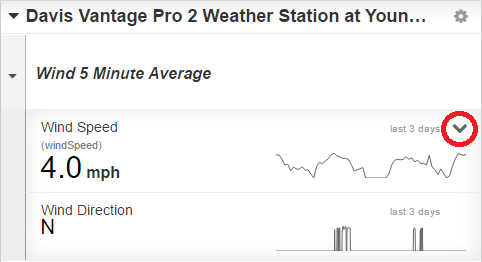
You can now access the ‘Settings…’ screen (as was done with the temperature screens above)
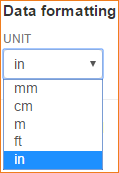
 and choose from a variety of different units of speed.
Similarly, if you expand the rainfall section, you can then alter the units of measure for rain-totals as well.
Other Units of Measure
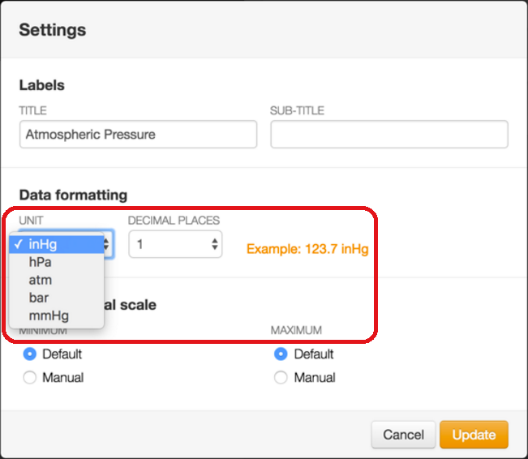
In a similar fashion it is possible to modify the Monitor Application graphs for pressure,
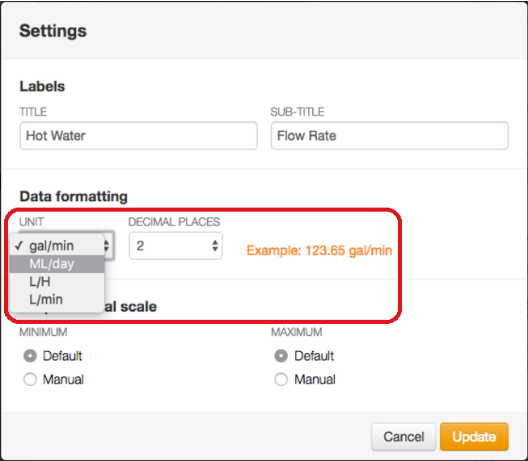
and for flow rate,
and for height.

These Settings screens allow you to customize your Monitor Application charts to best suit your particular situation.