This article will discuss the following:
- Simplifying the Process
- How Data Is Displayed in Observant Global's Crop Manager Application
- How to Set Management Boundaries
- How to Use Data from the Management Data View to Make Irrigation Decisions
- Links
Observant’s goal is to enhance your ability to use soil-moisture-monitoring technology to develop consistently-wise irrigation decisions.
An annoying complication associated with soil-moisture probes and sensors is the calibration needed to convert their raw data into units of measure that are considered meaningful, such as the percentage of Volumetric Soil Moisture (VSM %). Because proper soil testing and sensor calibration can be both tedious and prone to error, the accuracy of the data produced may be questionable despite the time and expense expended to produce it.
What truly matters to most of us is our ability to keep soil moisture levels within a particular range (typically between a given field's water holding capacity and a moisture level that incurs stress on the crop). Observant’s approach, therefore, shifts the focus from reliance on calibrated, absolute values to a judicious use of raw sensor data — expressed in arbitrary 'Moisture Units' (MU) — to monitor changes in moisture levels.
Using the Observant Global™ software platform, you can maintain the water content of your crops' root zones within predefined boundaries (the green zone in the diagram below). 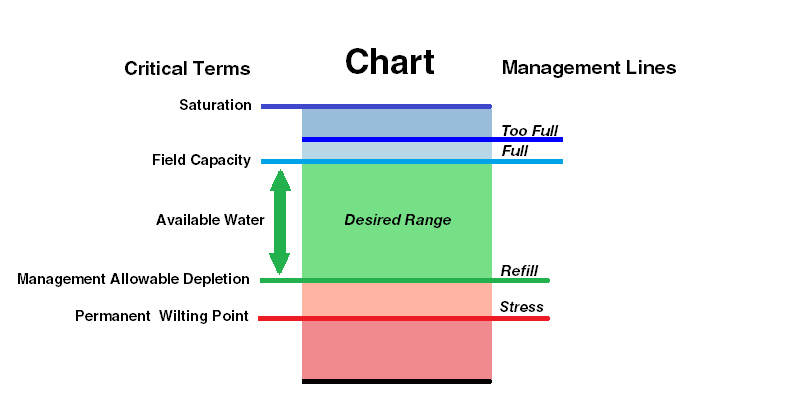
You will be able to reduce the likelihood of having a crop stressed by a moisture deficit and avoid excess expenditure of your water resources. Observing the trends of moisture data in your crop's root zone will support increasingly effective and efficient irrigation decisions.
How Data Is Displayed in Observant Global's Crop Manager Application
Snapshot View
In Observant Global's Crop Manager application, you are presented with a 'Snapshot View' of the current soil moisture status at monitored locations.
Below, we see the precise location of a soil probe depicted with its associated bar chart.
The value of 64% is determined by the last set of soil moisture readings. In this case, it represents 64% of the moisture range defined by the placement of the "Refill" and "Full" Management Lines (as illustrated in the above, "Chart" diagram).
Management Data View
Clicking on any bar chart, in Snapshot View, produces its 'Management Data View,' a graph of changing root zone moisture levels over time. The single plotted line in the graph below is actually a 'Root Zone Summary' — a weighted combination (average or sum) of the raw, individual soil moisture sensor readings at various depths over time. You can assign larger weights to data from specific depths within the crop's root zone. It's then the soil moisture content at those depths that informs increasingly appropriate irrigation decisions.
The Management Boundaries are the upper and lower edges of the green band. Note that the values plotted on the chart's y-axis are simply the uncalibrated Moisture Units mentioned previously.
For a discussion of these and other key definitions, as well as aspects of Crop Manager not covered here, see Overview of the Crop Manager and Analyze Applications.
Here are various charts examining a site with an EnviroPro soil probe providing moisture and temperature readings.
Root Zone Summary of Soil Moisture (Only)
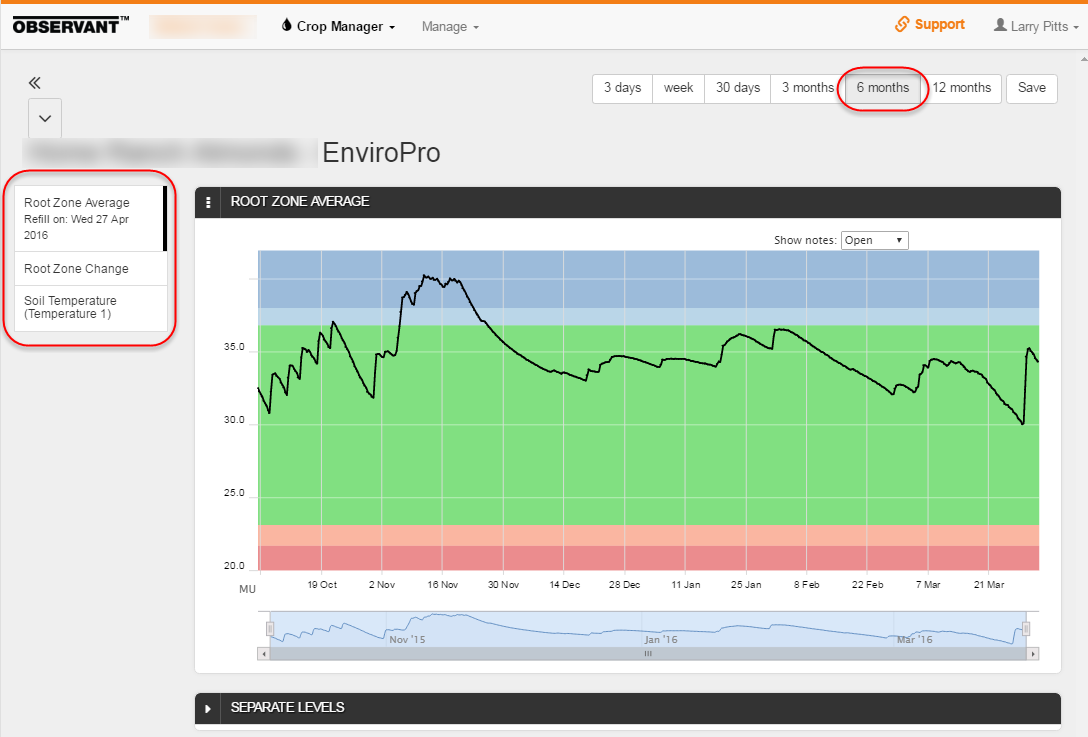
Different time spans are readily available, and, in this case, we've chosen to examine six months of data.
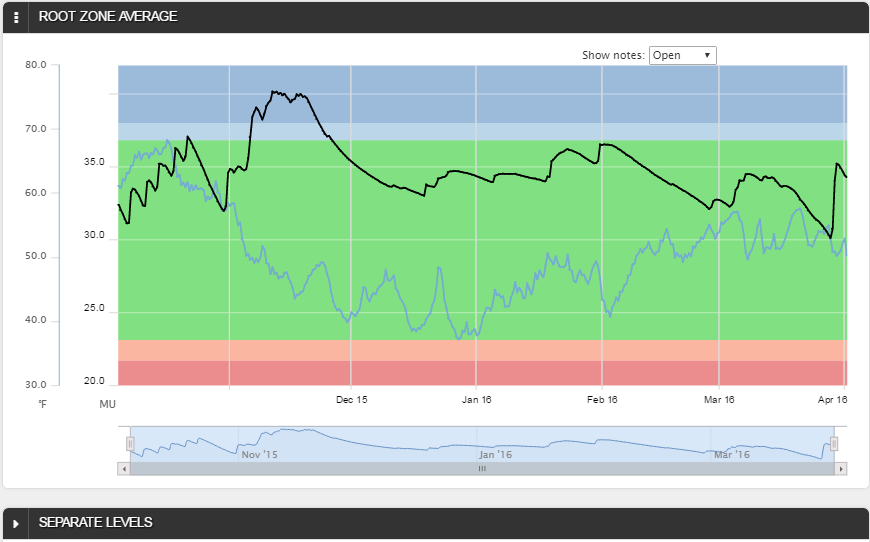
Note the three buttons to the left of the chart. They toggle on and off graphing of the Root Zone Summary (in this case, a weighted average), the relative amount of water gained or lost daily and the Soil Temperature.
Root Zone Summary of Soil Moisture + Temperature
Root Zone Summary of Soil Moisture + Temperature + daily Root Zone Change in moisture level
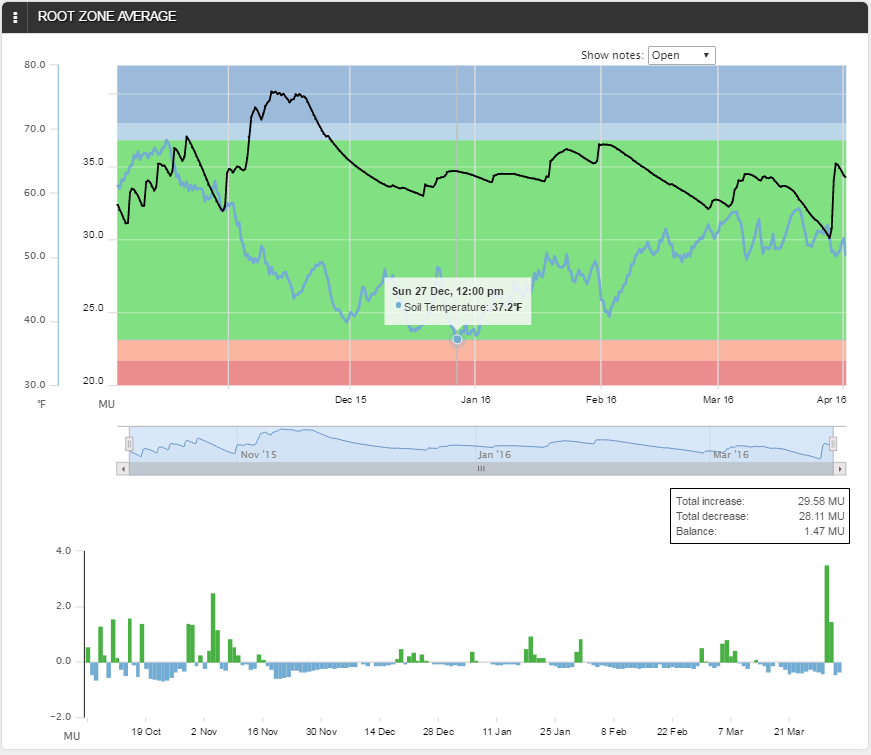
Over this six month period, we can see that, on balance, this site gained just a bit more moisture than it lost
Raw Data View
Clicking on the small triangle (►) on the left side of the SEPARATE LEVELS bar drops down a 'Raw Data View,' which allows you to select the data from each soil level as reported by the individual sensors of a multi-sensor, soil-moisture probe.
Raw Moisture Data from the Top Four Sensors

Here, we see that the probe has sensors positioned throughout the root zone at four inch intervals (from four inches to four feet). By clicking on the "Root Zone" button we have been able to select just the top four sensors for graphing.
Note the gear cog button in the upper right.

Its menu allows you to chose to display the individual sensor data either separately (as above) or on the same graph (as below).
Moisture Data from the Top Four Sensors Displayed Together on the Same Chart
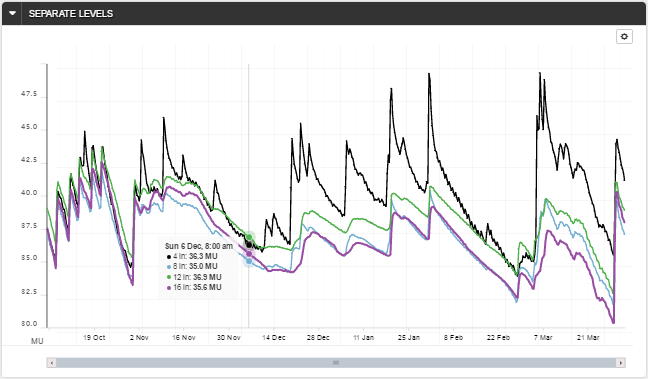
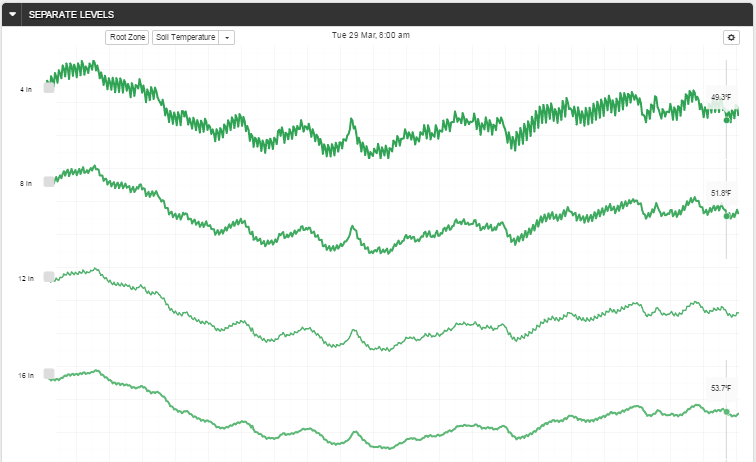
The Soil Temperature button, replaces the root zone moisture data with temperature data (from the same sensors).
Temperature from the Top Four Sensors Displayed Separately
More Features
To see more features of Observant Global's graphing capabilities, such as:
- configuring Management Level,
- configuring Root Zone Settings,
- Pan and Zoom Features and
- adding Comments,
see Crop Manager — a Detailed Guide.
How to Set Management Boundaries
The upper boundary can be established by observing soil moisture charts over the course of several irrigation cycles. With some practice, just by observing the moisture trends revealed by the charts, you can learn to see when a site's saturation level has dropped to the soils field capacity.
The lower boundary can be set by observing soil moisture in the field (with the hand-feel method) and setting the desired lowest level of soil moisture to the corresponding value reported by the probe at that moment in time.
For a detailed discussion of this subject, see the Using Soil Moisture to Make Irrigation Decisions section of Monitoring Soil Moisture for Optimal Crop Growth (just look for "Management Lines").
How to Use Data from the Management Data View to Make Irrigation Decisions
Once the management boundaries are set, the Management Data View will give you a graphic indication of how your crop's soil moisture levels are trending in relation to the desired limits. You can then adjust irrigation practices accordingly.
Be sure to read the Using Soil Moisture to Plan Irrigation section of Monitoring Soil Moisture for Optimal Crop Growth for helpful advice on this very important topic.
Links
Articles
- Monitoring Soil Moisture for Optimal Crop Growth
- Overview of the Crop Manager and Analyze Applications
- Setting Management Boundaries
- Limiting a Chart's Moisture Range in Crop Manager
- Crop Manager — a Detailed Guide
Videos
