
A list of Help Desk articles for each application may be found following this article. A five minute instructional video, Overview of the Observant Global™ Software Platform, is also available.
Topics
This article will discuss the following topics:
- Set Up
- Logging In
- Welcome Page
- Features of the Menu Bar
- Getting Support
- Applications
- Monitor
- Locate
- Analyze
- Alert
- Schedule
- Crop Manager
- Summary
-
Links
Set Up
To access your personal section of the Observant Global™ system, contact Observant (at least a day before your equipment installation) via the Observant Help Desk by clicking on "Submit a request" in the upper right-hand corner of the screen.
Observant will then provide a unique username and password.
Logging In
To access the system, open a web browser (for best results, Observant recommends using the Google Chrome) and go to app.observant.net Here you will input the username and password you have received from Observant.
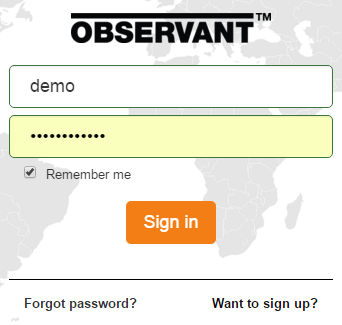
In this case, we will simply use a demo website.
Welcome Page
When logging in, if you have not chosen to open a specific application, you will start at the Observant Global system's welcome page.
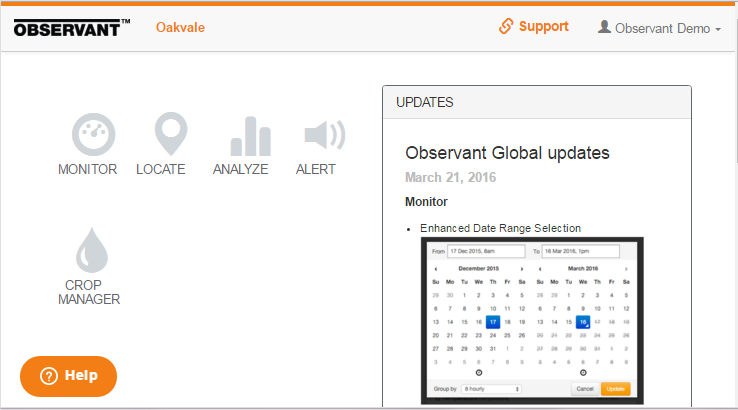
It is divided into two sections:
- The Application Section – a group of icons, each providing access to a major feature of the Observant Global system.
- A Text Section – featuring noteworthy news, such as details of the system’s latest update.
You can return to this page from any of the applications by simply clicking on Observant in the upper left corner of the screen.
Features of the Menu Bar
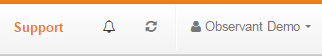
When the Observant Global software platform opens, it displays the name of the account in the top, right-hand corner of the screen. (In this case it is Observant Demo.) Note that the user name and the account name are not necessarily the same.
Settings
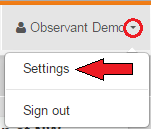
Clicking on the small triangle just to the right of "Observant Demo" and then choosing "Settings" from the drop-down menu allows changing administration settings.
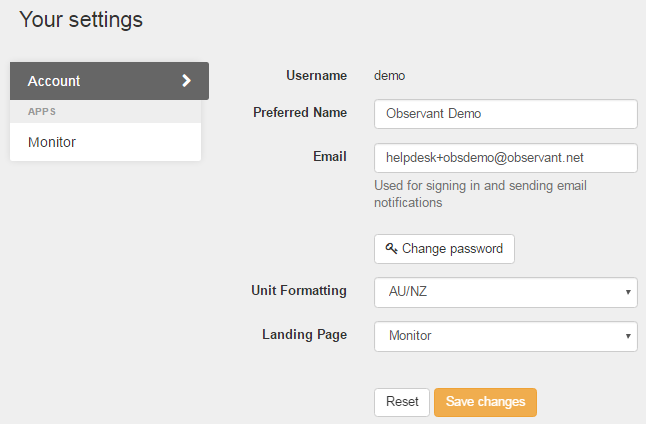
This is where you would change your password and possibly the email address used for sign in.
Screen Refresh
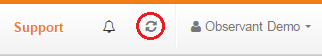
Clicking on the Refresh icon (the two circulating arrows) updates the data displayed. By choosing to refresh after a system change or component state change, the page can often be updated before the required time threshold that is normally used.
Notifications
The Notifications button (the alarm bell) can be pressed to see if there are any outstanding notifications.
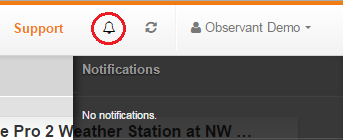
To remove the notifications panel, just click the button a second time.
Getting Support
Support via Observant's Help Desk
Click on Support to go to our Help Desk, where we have a comprehensive library of articles to inform and guide users of Observant's equipment and services. For a detailed description, refer to Getting support.
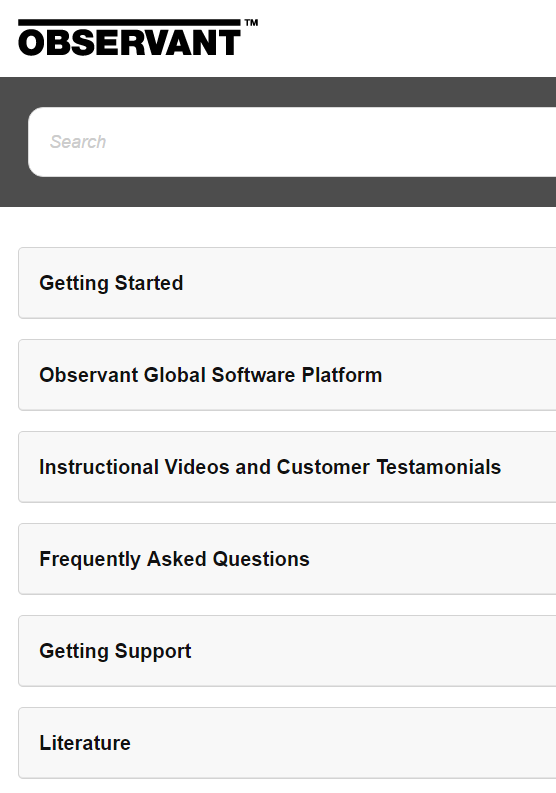
This 'Knowledge Base' is continually updated to ensure that our customers have access to the very latest information.
From the Help Desk you may also submit 'tickets' through the Observant Global system to get assistance with specific questions not yet covered by existing articles. Just click on "Submit a request" in the upper right corner of the screen.
Refer to the article, Requesting Support for further details.
Support via the Help button
In the lower-left corner of the Observant Global screen you'll see an orange "Help" button.

Clicking on it allows rapid access to material stored in our support library without going directly to the Help Desk.
Curious about soil moisture? Click on "Help" and enter "soil moisture" in the text box.
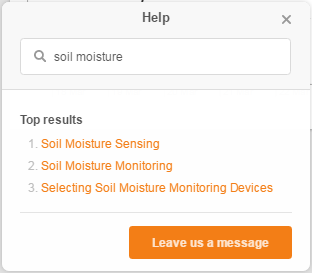
Click on number three, and you'll find the text of the relevant Help Desk article (along with its links).
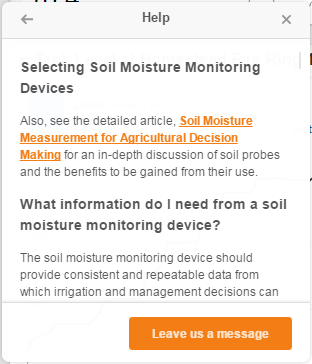
You can then scroll through the article using your mouse wheel.
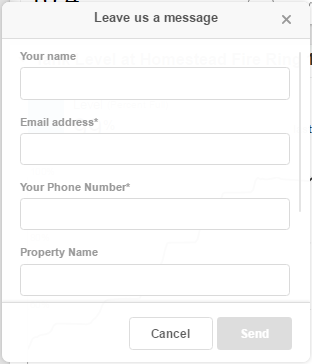
If you can't get the information you seek, simply click the "Leave us a message" button, fill in the form and click "Send.".
Read the article, Requesting Support, to learn more.
Applications
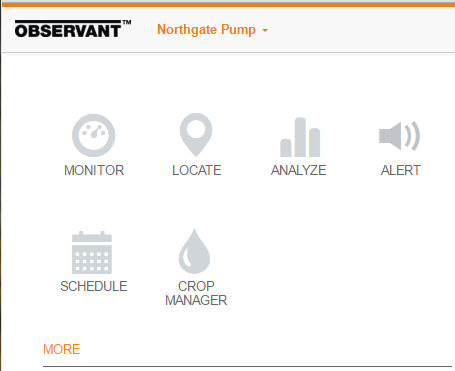
The six major applications of Observant Global software platform are:
-
Monitor—giving access to the data provided by sensors and (optional) camera.
- Locate—providing a view of the precise location of sensor installations.
- Analyze—allowing multiple sensors to display their data on a single graph.
- Alert—providing timely email or SMS messages regarding the status of critical information.
- Schedule—allowing the control of various equipment and sensors at specified times.
- Crop Manager—displaying the locations of installations, their data, and any scheduled photos.
From the Welcome Page, click on any application icon to go to its web page.
Monitor
The Big Picture
The default landing screen is the Monitor application. It is typically used as a summary page, displaying the overall status of the equipment deployed at the chosen location.
The data presented can be from a wide variety of sensors, depending on which accessories are connected to the telemetry unit and the layout and details of the associated Monitor Cards.
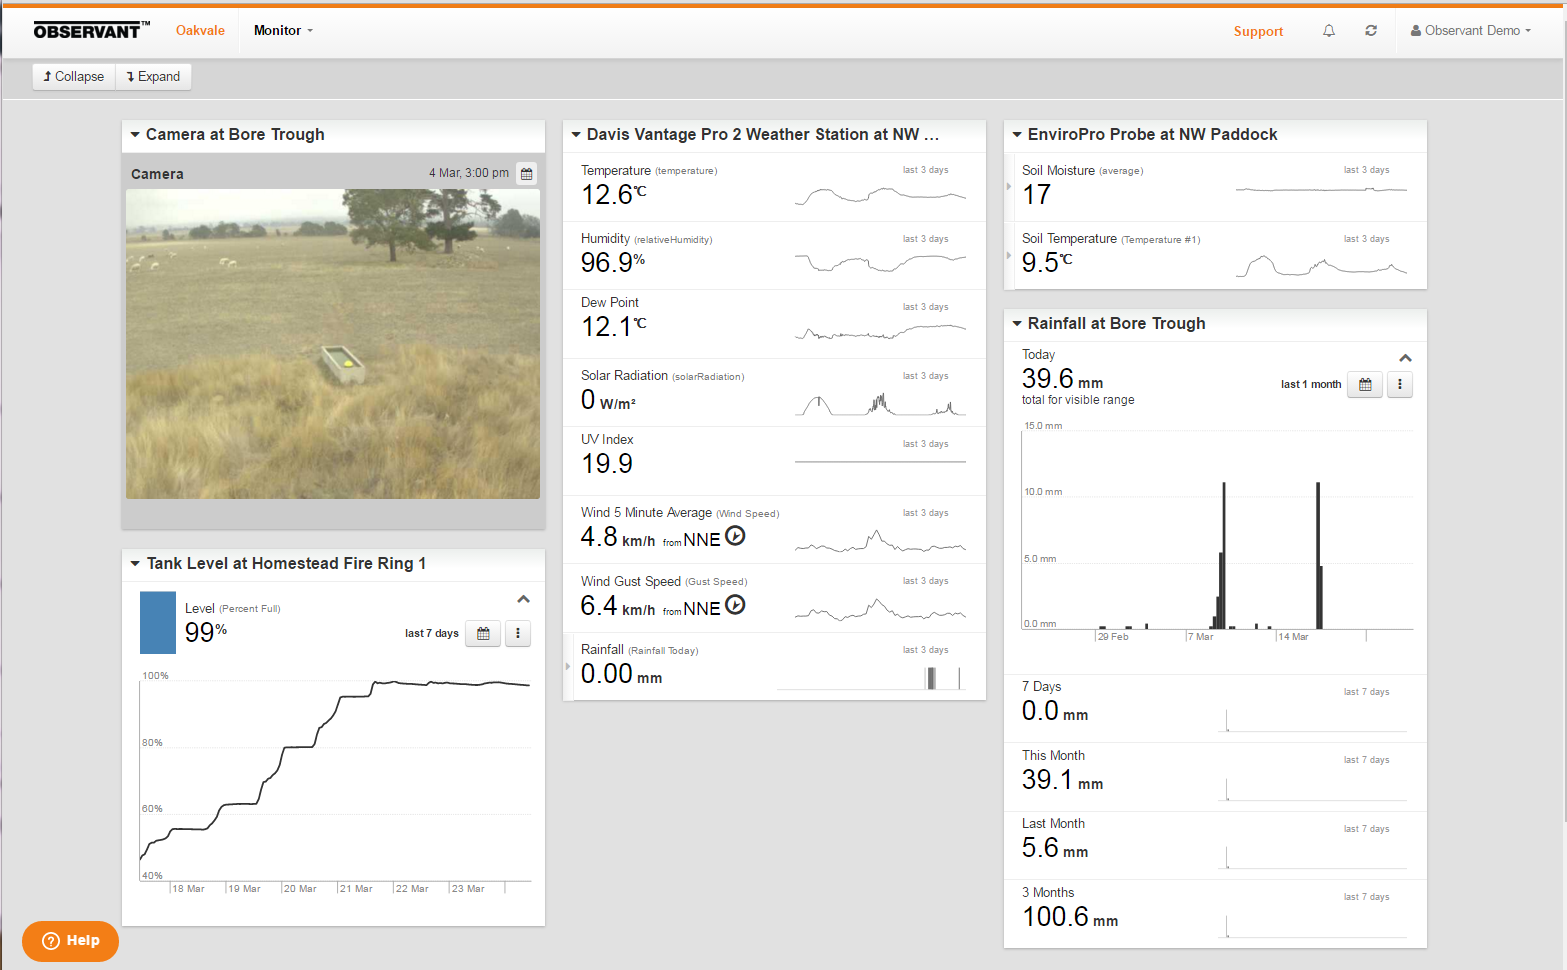
By reviewing the individual status of each device, it is possible to quickly determine if there are any issues or devices requiring attention.
Looking Closer
A small graph, known as a sparkline, (just to the right of a sensor's latest logged status) is used to visualize recent changes in each sensor's data.
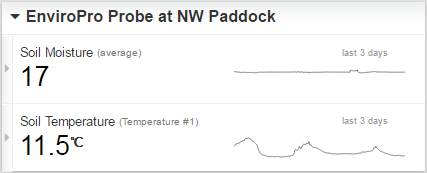
Clicking the tiny triangle (►) on the left margin of the NW Paddock's Soil Moisture sensor display
![]()
causes it to point downward (▼) revealing the latest logging of all the data associated with that probe.
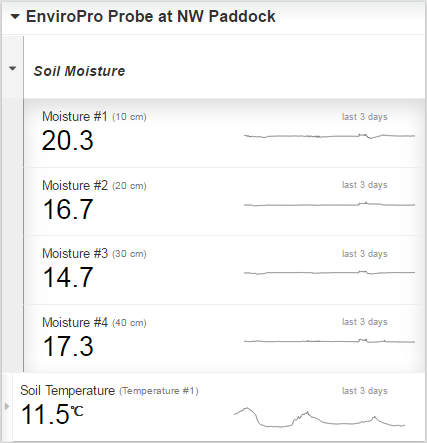
Here, we see that it has four sensors, evenly spaced at 10 cm intervals, and that there has been very little change in moisture over the last three days.
Double clicking on the sparkline of the 10 cm sensor, for example, presents a more detailed graph of the data. Since it is auto-scaled, it displays an 'up-close' look at relatively minor variations in soil moisture.
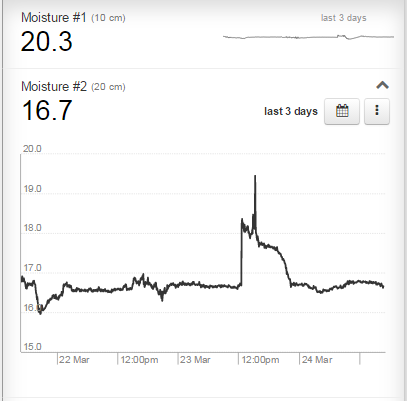
The Y axis is, in this case, is displayed in uncalibrated Moisture Units. For an understanding of this term, as well as other key definitions, see our Overview of the Crop Manager and Analyze Applications.
For an even more detailed description of Observant's approach to displaying and utilizing soil moisture data, read Monitoring Soil Moisture for Optimal Crop Growth.
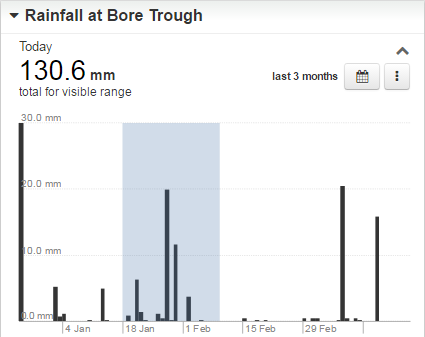
And the Total Is . . .
For data such as flow, energy, rainfall, etc., the Monitor application displays accumulated totals for whatever time span is selected. Here's a one-month view (as seen in the view of the total screen above).
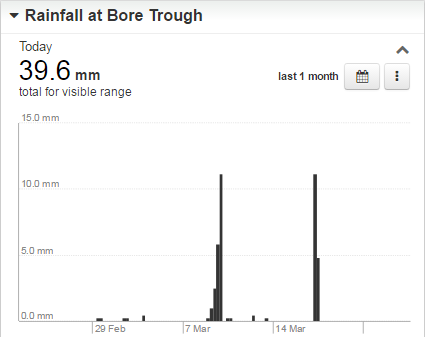
By clicking on the calendar icon we can easily expand the time frame.
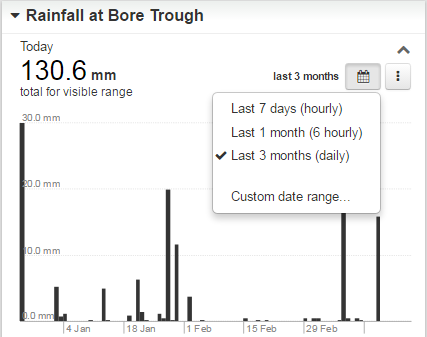
Here, we've expanded the view from one month to three.
In addition to the standard fixed spans, by clicking on the calendar icon and choosing "Custom date range..." it is also possible to establish a particular time span. Just choose start and stop dates from the two monthly displays.
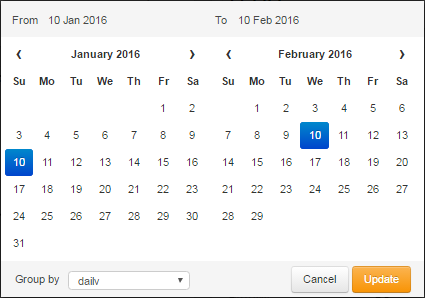
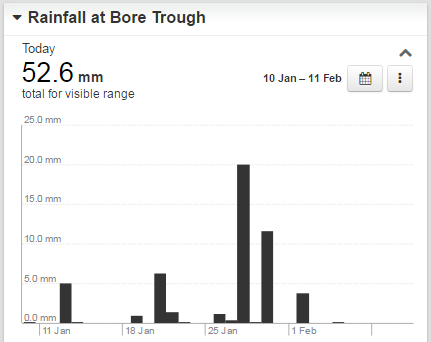
Here's what happened just from January 10th to February 10th.
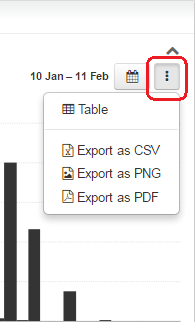
By clicking on the three vertical dots next to the calendar icon, it is also possible to export these data as either a CSV, PNG or PDF file.
You can also chose a time span to display by simply dragging a box around the area of interest .
Choosing the area shown above produces the graph below.
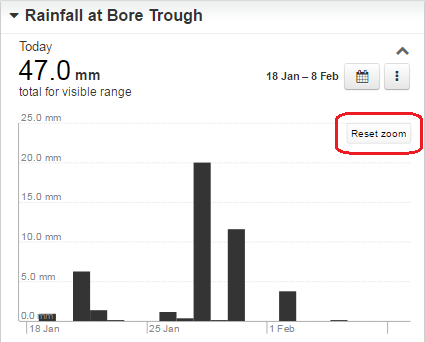
You can simply click the "Reset zoom" button to return to the previous display.
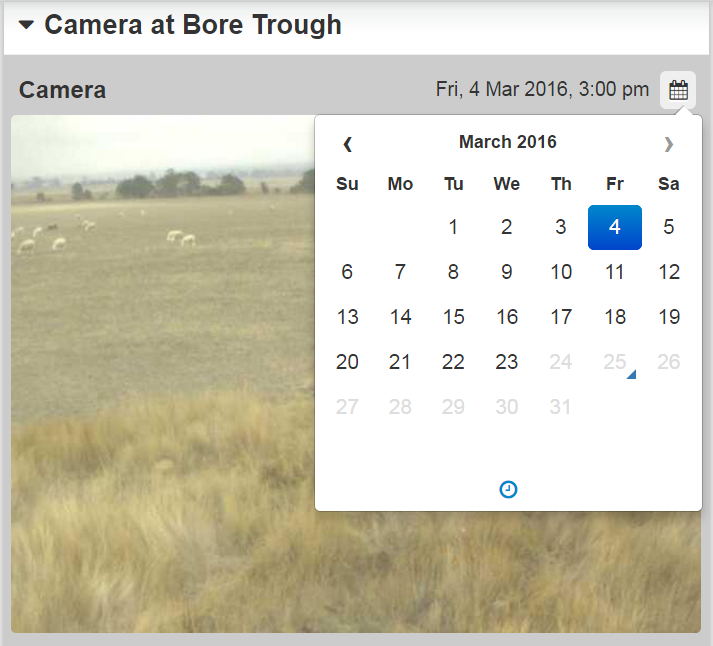
Viewing Photos
When viewing photos, it is also possible to choose a specific date by clicking on the calendar icon and choosing the desired day.
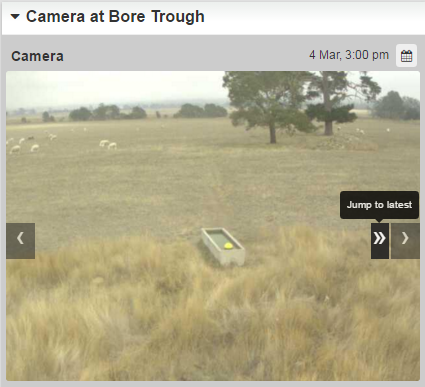
To return to the most recent photo, just use the "Jump to latest" button.
Several articles discussing the Monitor Application are available here.
Locate
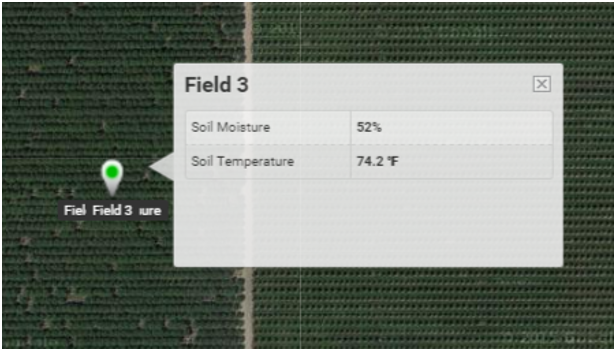
The Locate application uses the various Field Units’ GPS to show their precise location on a Google map. Each unit shown is accompanied by a summary of its latest status.
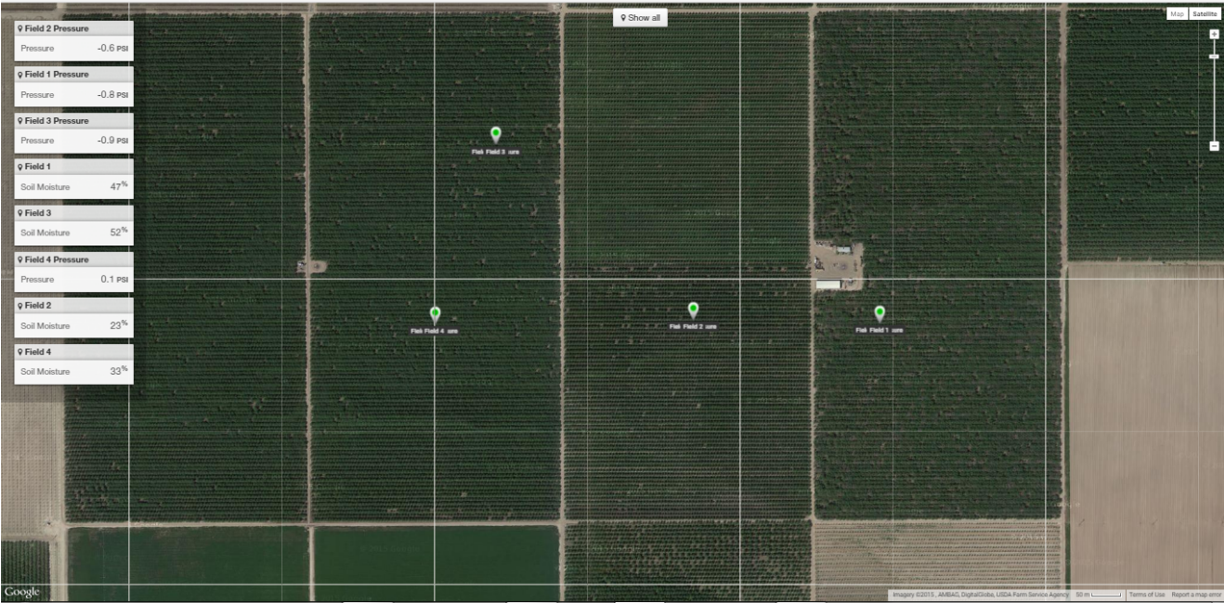
Hovering over a particular unit with the mouse reveals its most recent data.
Additional Locate Application articles are available here.
Analyze
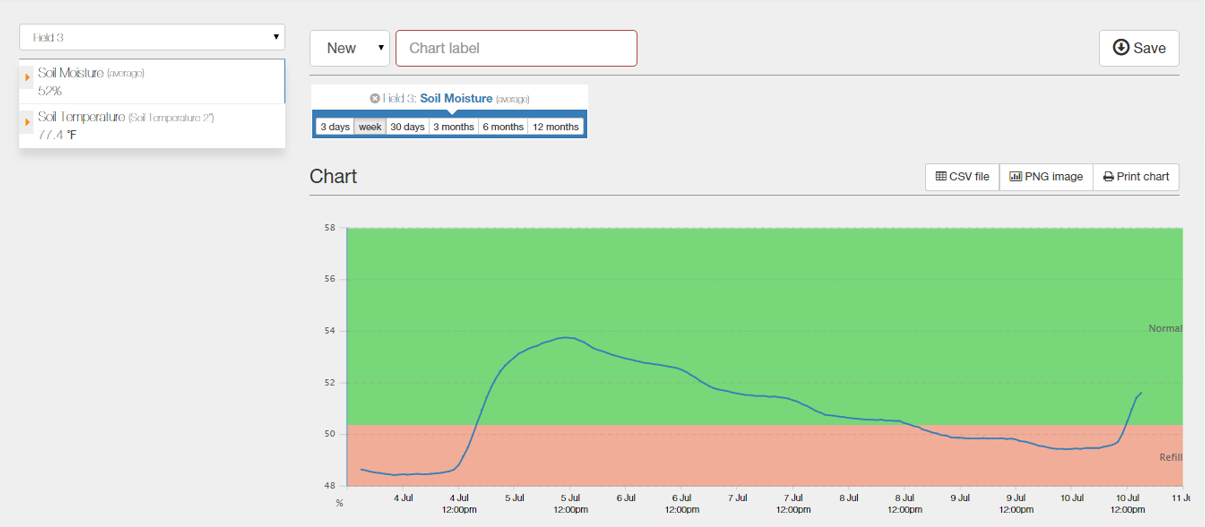
The Analyze screen offers an ideal way to compare the interrelation of data reported by a multitude of sensors and farm equipment. With it, you can quickly create charts showing, for example, the effect of irrigation on soil moisture (over time and at different depths).
To create a custom graph, just select the portfolio you wish to examine (in this case, Field 3). Then, in the resulting list, choose which ones to graph (here, Soil Moisture).
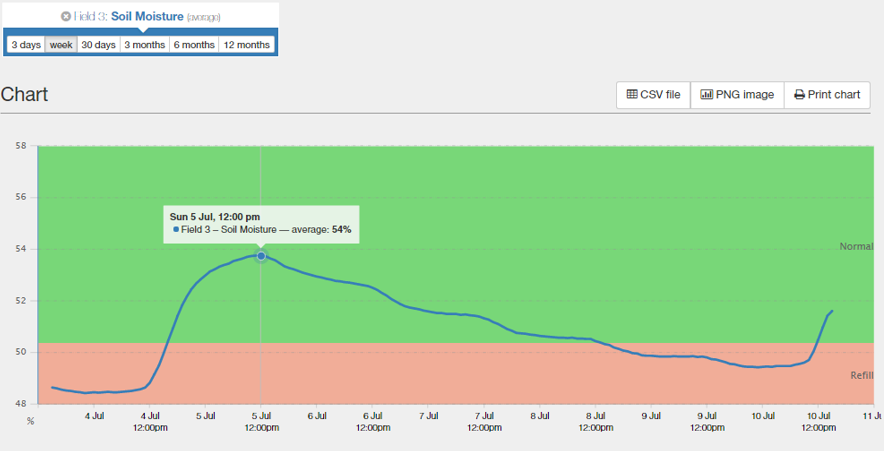
Placing the cursor anywhere within the graph displays the actual value of each plot at that specific moment in time.
Each item’s plot will be added to the chart as it is selected. A legend, showing each plot’s specific color code, is displayed above the chart.
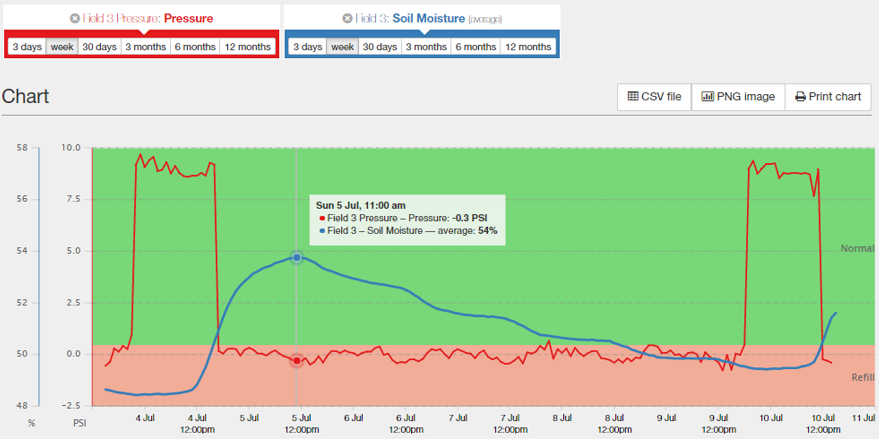
It is then possible to determine the display’s time span. Here we’ve changed it from a week to three days.
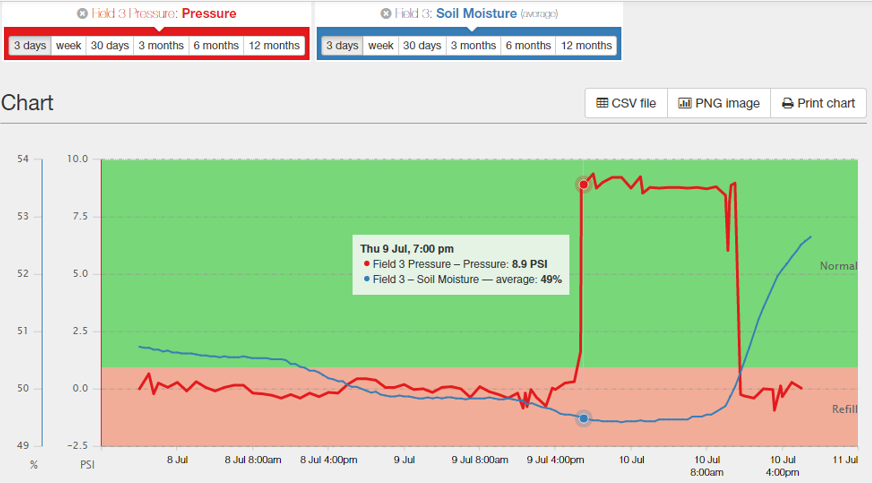
If desired, the completed chart can be printed, saved as a PNG file, or have the raw data exported as CSV file for use in a spreadsheet.
An additional Analyze Application article is available here.
Alert
To set up an alert for a significant change (such as low battery, communications failure, low water level, or pump failing to start), in the Alert screen click the “Register Another Alert” button. Doing so will bring up the alert configuration screen. You may choose to have the alert sent to the email address associated with your Observant Global account or (via SMS) to your smartphone. Enter the phone number and click “verify.” You will then receive then receive a 4-digit confirmation code. Enter that, and again click “verify.”
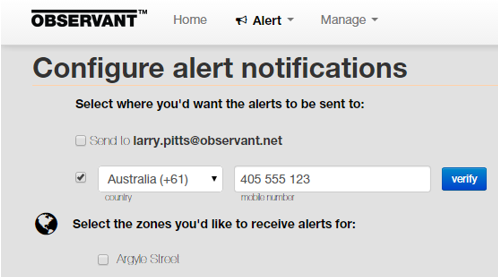
Select the particular zone for which you wish to receive the alert. Choose whether to receive a “Daily Summary” or “Only if there are alarms.” If you wish, you can also restrict the time of day when alerts are sent.
Additional Alert Application articles are available here.
Schedule
Note: additional Schedule Application articles and videos are available here.
The Observant Global system's Schedule feature doesn't just show the location of Field Units controlling various farm equipment; it allows the equipment to be manipulated in the future according to predetermined schedules.
Here the screen shows events that have been scheduled.
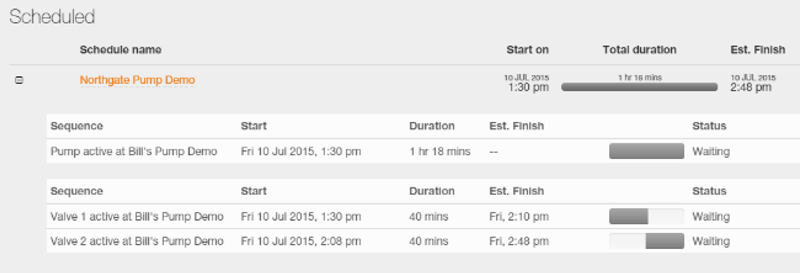
Now the event displayed is in progress.
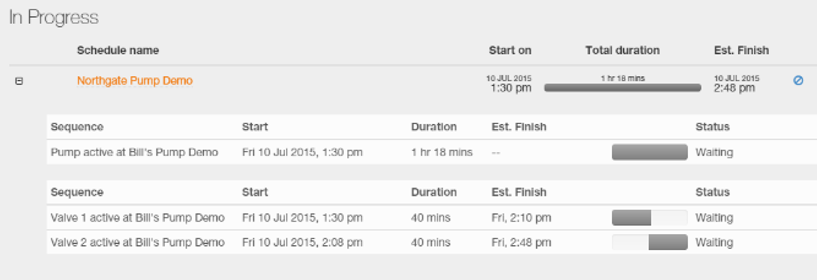
And finally, here we see the events that have been completed.
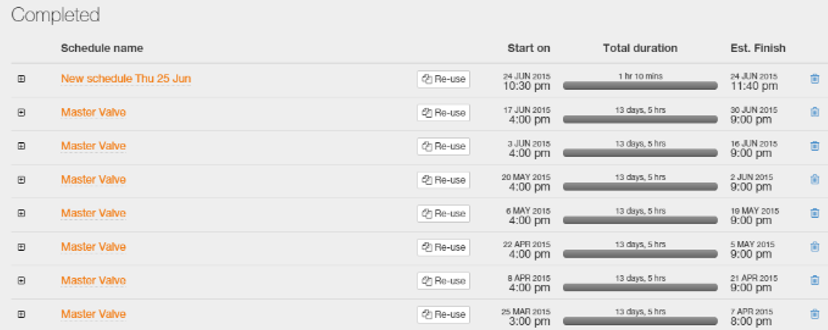
Note that it is easy to save command sequences for reuse at a later date.
Crop Manager
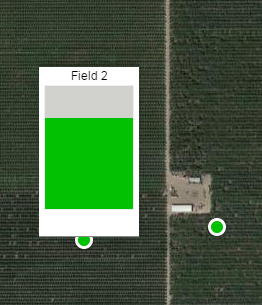
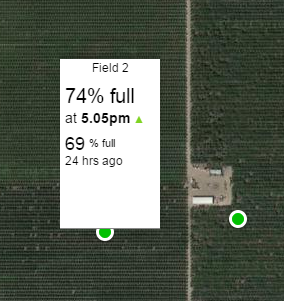
Crop Manager allows a quick visualization of the status of a group of sites. Displayed as color-coded dots on Google Maps (as in the Locate app), each location’s sensor is accompanied by a column showing visuals of its most recent status. Hover over a location and it will be identified.
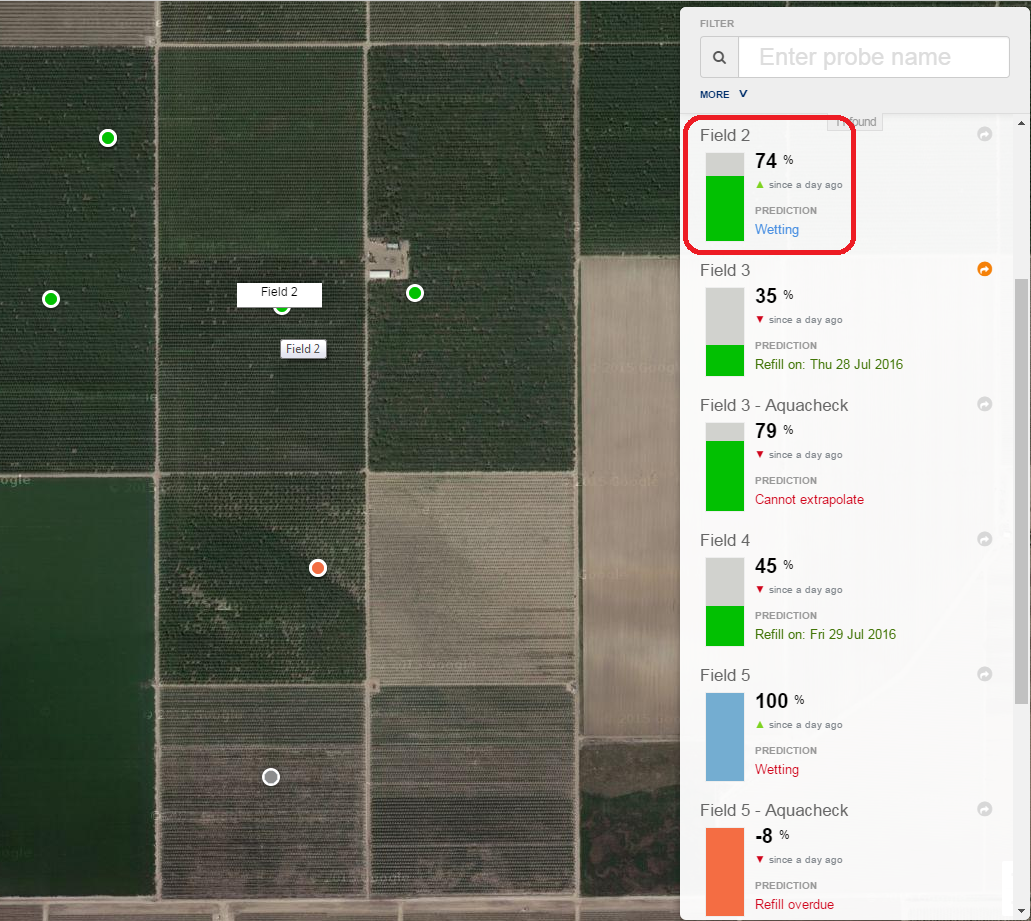
Click on the location dot, and its bar graph appears.
Click on that, and it spins around to provide more data.
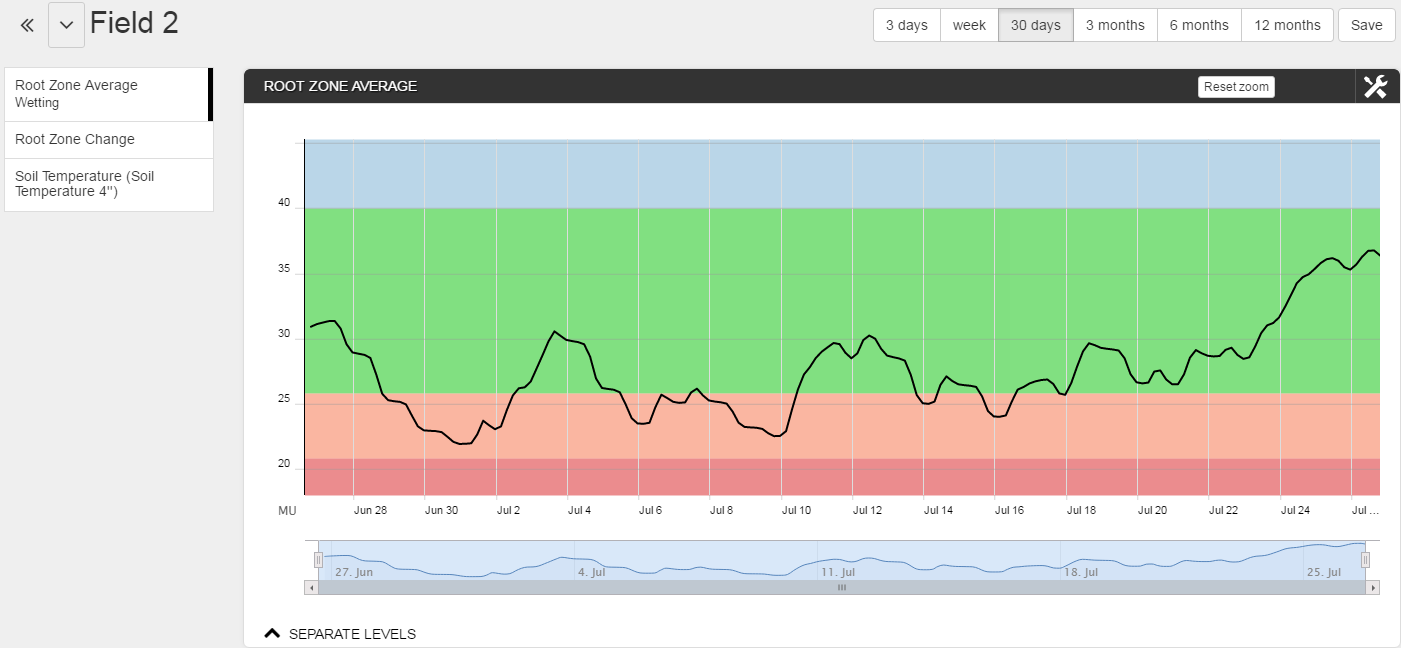
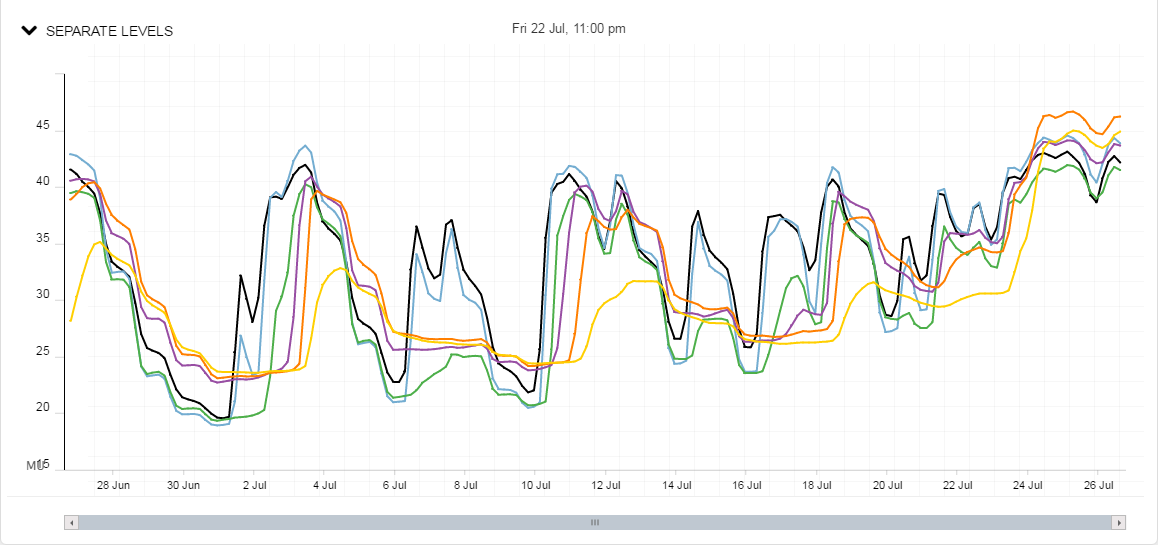
Click on Field 2 in the side column (outlined in red above), and a full plot of data from three days to twelve months becomes available. Here is a a display of the weighted average of Field 2's soil moisture probe.
Notice that by clicking on '^ SEPARATE LEVELS' it is possible to show individual levels of a moisture probe as well — either as separate graphs:
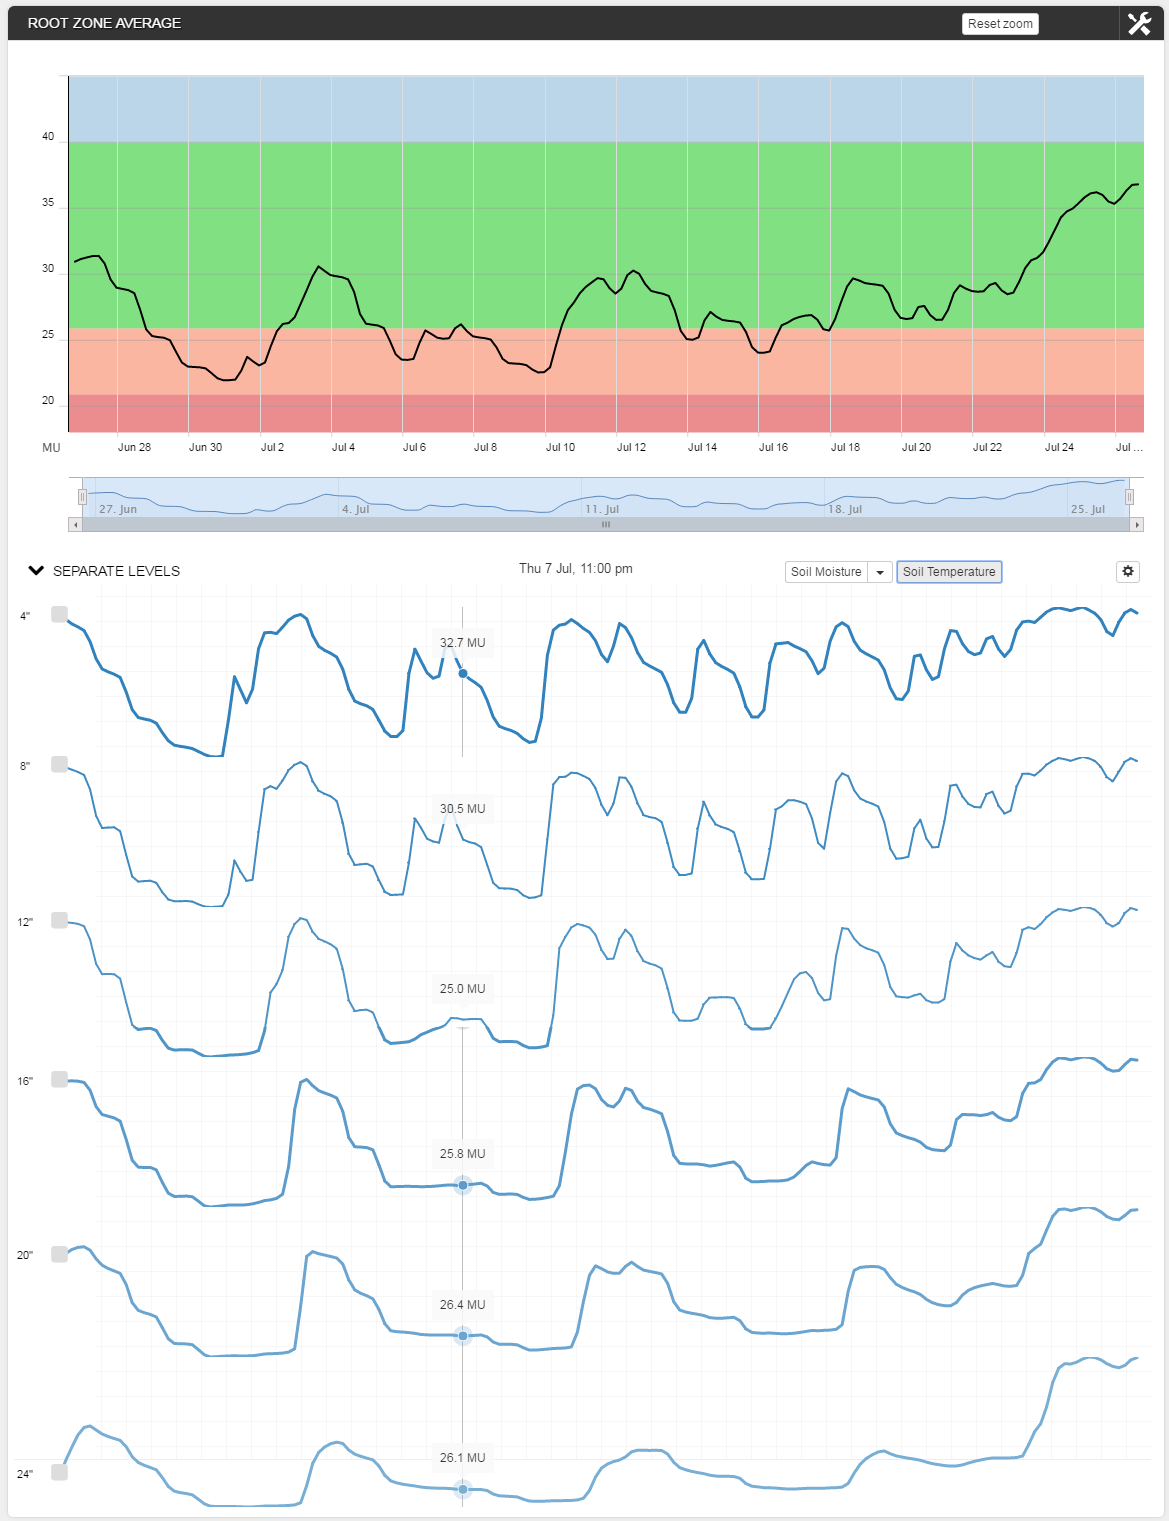
or, if you wish,
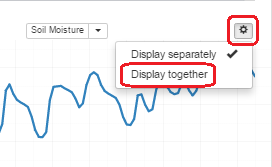
as multiple plots on a single graph:
More information on the Crop Manager Application's ability to extract and display information is available here.
Summary
The Observant Global system is a fully integrated, information platform capable of significantly enhancing the efficiency of the modern farm. Growers who have employed it report reduced water, energy and labor costs.
Links
For additional Observant Global articles, click on any of the following Help Desk sections: