Description
Certain measuring devices output their data in the form of digital pulse trains. Important examples include pulse output water meters and electrical energy meters. Observant telemetry field units can provide water flow data by counting pulses from a water meter or energy consumption data by counting pulses from an energy meter. The water volume (or amount of energy) represented by each pulse is determined by the manufacturer of the particular meter being used. That quantity should be described in its accompanying documentation.
The C3 field unit uses one of its four input ports to count the pulses provided by the meter. Our Observant Global™ software platform then converts that pulse data into display values with appropriate engineering units, which can be charted over time.
In the case of flow meters, the pulse frequency is converted to flow rate (GPH OR LPH), and the number of pulses counted over time is converted to energy use (kWh). These rates can be calibrated to correlate closely with the dial readings of the meter in use. Accumulated totals then can be displayed for a specific time span or an entire season. Such information is especially helpful when dealing with quotas for water or energy consumption.
A flow meter that has been integrated with the Observant Global platform can readily provide:
- The latest logged flow rate.
- Graphs of historical data (both flow rate and total flow are logged every 10 minutes).
- Historical totals — for today, this week, this month, last three months, etc.
- Seasonal totals (or any user-defined range)
- Cumulative water or energy use since a user-defined date.
Supported hardware
Connection of Observant hardware is not limited to specific flow meters; meters utilizing either dry contact relay or open collector outputs are the only generic class of meter supported. Typical examples would be contact-closure or reed-switch meters. Consult your local reseller for appropriate guidance based on your specific application.
Typical Applications
- Drip irrigation.
- Pivot irrigation.
- Sprinkler irrigation.
- Microspray / Microsprinkler irrigation.
- Furrow irrigation.
- Energy input to electric pump
- Tank inlet or outlet flow
Installation
The two wires from contact-closure (or reed-switch) flow meters are connected to the field unit’s input port. Before connecting your flow meter, always consult the manufacturer’s manual for specific wiring instructions.
C3
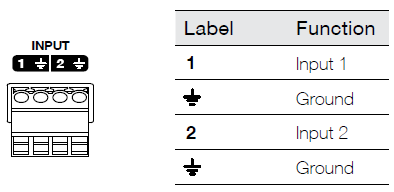
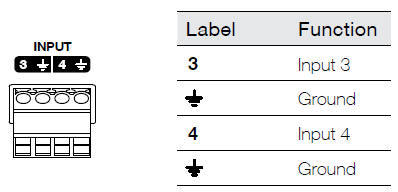
The C3 field unit has four input ports (see figure below). Each input port supports a single flow meter. Since there is no polarity to the two wires of the meter cable, it doesn't matter which is connected to ground and which goes to the input.
|
C3 Input Port Terminals |
Typical meter wire colors |
|
Ground |
Black |
|
Input (1, 2, 3, or 4) |
Red or White |
Solo+
The Solo+ field unit has two input ports (see figure below). Each input port supports a single flow meter. Since there is no polarity to the two wires of the meter cable, it doesn't matter which is connected to ground and which goes to the input.
|
Solo+ Input Port Terminals |
Typical meter wire colors |
|
Ground |
Black |
|
Input (1, or 2) |
Red or White |
Meter Reading Calibration and Seasonal Flow Totals
The Observant Global software has the ability to display flow data in a manner consistent with the readings on the flow meter itself. The process of making the appropriate changes in the system is referred to as 'Meter Reading Calibration.' If, in Observant Global, the current recorded flow, from the supplied calibration date, is added to the supplied calibration total the resulting value should provide a total that closely matches the visual meter reading. This can then be used to confirm proper operation of the system
Calibration
Use the following steps to calibrate the Observant software platform to the visual display on the face of a flow meter:
- From the dial on the meter in question, record:
- A specific non-zero reading.
- The time at which that reading was taken.
(These two values are the only data necessary to perform the calibration.) - Verify that your Observant account includes the permissions required to configure your system from the device’s “cog” menu in Observant Global.
- Click on the cog in the upper right of the meter’s display in Observant Global™.
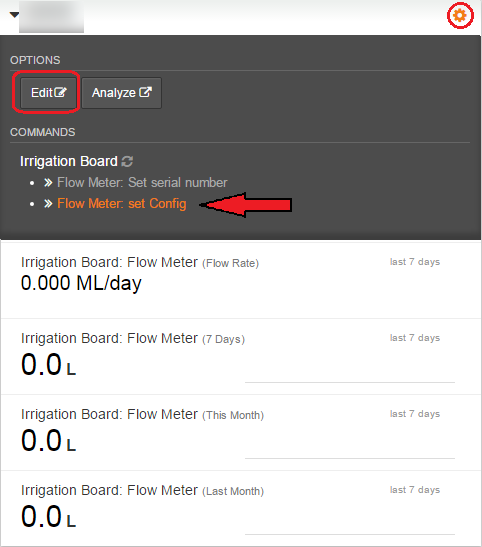
- From the drop-down menu select “Flow Meter: Set Config.”
- In the resulting screen, click on the calendar icon.
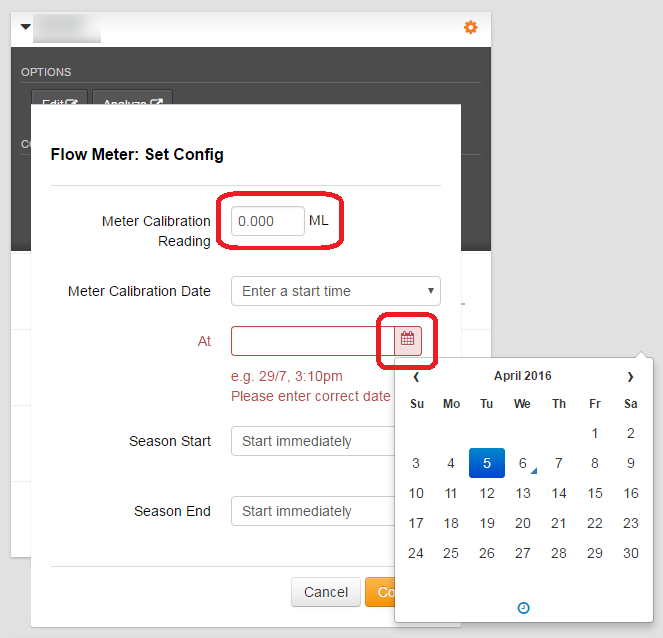
- If you have just taken the reading from the flow meter, you can leave the default "Start immediately" as the Meter Calibration Date. Otherwise, from it's drop-down menu, choose "Enter a start time" and pick the date that you recorded the 'Meter Calibration Reading.'
- Finally, click on
 .
.
Once the meter reading settings have been supplied, the flow meter's Monitor Card can then include a value for 'Calibrated Reading' derived from the total recorded flow since the supplied calibration date, added to the calibration reading at that moment. From then on, the value displayed in Observant Global should continually keep up with the visual reading on the meter.
Seasonal Totals
Observant Global also provides support for a calculated seasonal flow total. This value is simply the total recorded flow between the “Season Start” and “Season End” dates.
Once these dates have been entered, the Monitor Card can be extended with the value 'totalFlowThisSeason' that will be the total calculated between the two dates.
“Season Start” and “Season End” date can be updated at the beginning of each new season.
Flow Display in Observant Global
Example: Here we see a display in Observant Global of a the accumulated flow total for the week of pump associated with a reservoir.

By clicking on the small triangle (►) on the left edge, we can expand the view of our flow information.
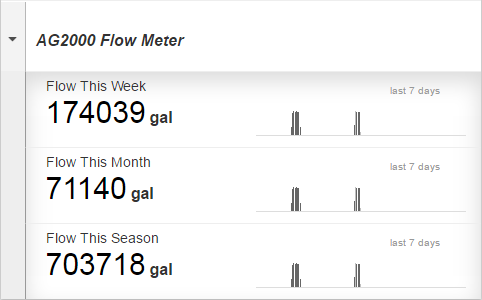
Now there are three bar graphs showing the total amount of water delivered:
- During the last seven days.
- During the last calendar month.
- During a user defined season.
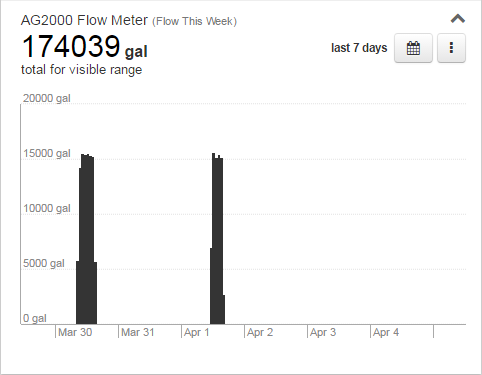
By clicking on any of the four graphs, you can easily expand them and take a better look, now with engineering units displayed on the vertical axis:
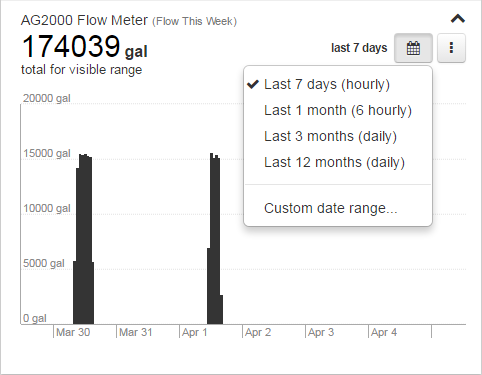
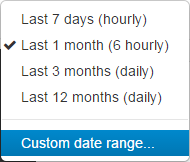
Clicking on the calendar icon, drops down a menu with a choice of date ranges
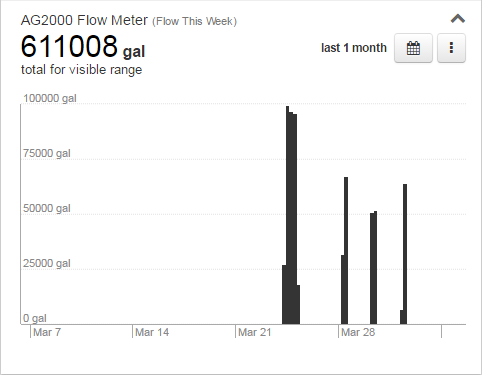
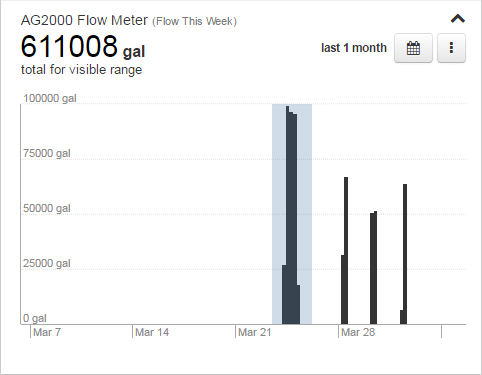
Here we've chosen to examine what happened in the previous month, March.
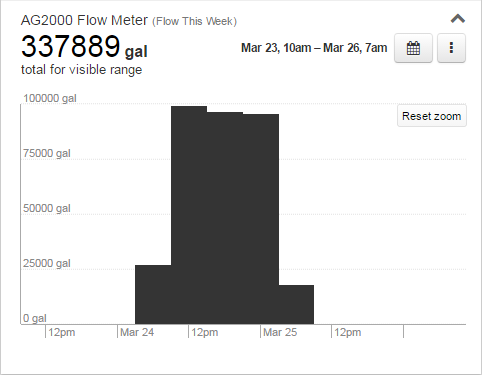
You also have the ability to zoom in on any particular portion of the graph for a closer look. Simply click anywhere within the graph at one end of the range you wish to examine an drag the resulting box to the other end of the range. Here, we have chosen to see what happened during that first event.
The graph now automatically adjusts to show this new range.
When we clicked on the calendar icon our last choice was "Custom range."
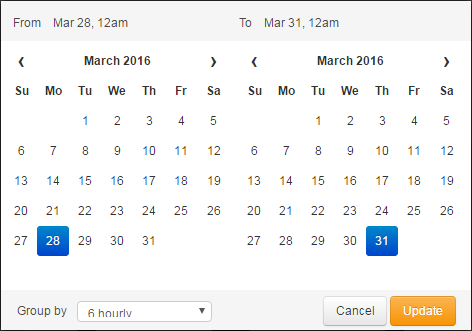
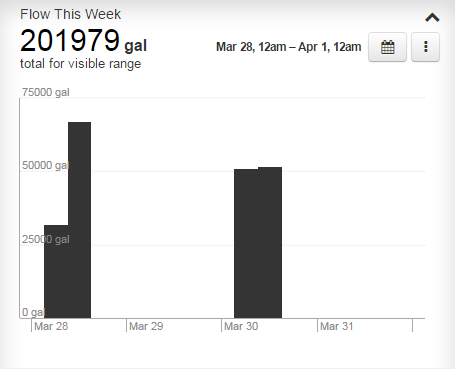
If you select that option, you can choose the dates at either end of the time span you would like to examine (and see its total flow). Lets take a look at the just the span from March 28 through March 31.
Using Flow to Discover Irrigation Issues
By monitoring flow you can receive early warning when something unexpected occurs. Here are some examples of the kind of events can be detected with flow measurement.Flow Alerts
The Observant Global can be configured to raise Flow Meter alerts on the following conditions:
- Flow rate too low - when flow rate is above zero but less that the set rate
- Flow rate too high - when the recorded rate is above the set threshold
- Daily total too high - when the total flow for the current day is above the set daily threshold
- Max time without any flow - the maximum time for any period of no flow
There is, however, no alert for zero flow. This avoids creating alerts whenever a system or zone is shut down deliberately.
If used in conjunction with Irrigation Scheduling, alerts can also be configured to only occur when the schedule is active.
Links
- Irrigation Scheduling
- Viewing Water or Energy Cumulative Use Since User-Defined Date
- Solution Brochure — Flow and Line Pressure Monitoring
- Solution Datasheet, Flow and Line Pressure Monitoring
