You can view the total value for a field like rainfall, water flow, electricity usage or run hours for a specific period using the 'Custom date range' option.
Expand the graph of the data you wish to view and select 'Custom date range...' from the calendar menu:
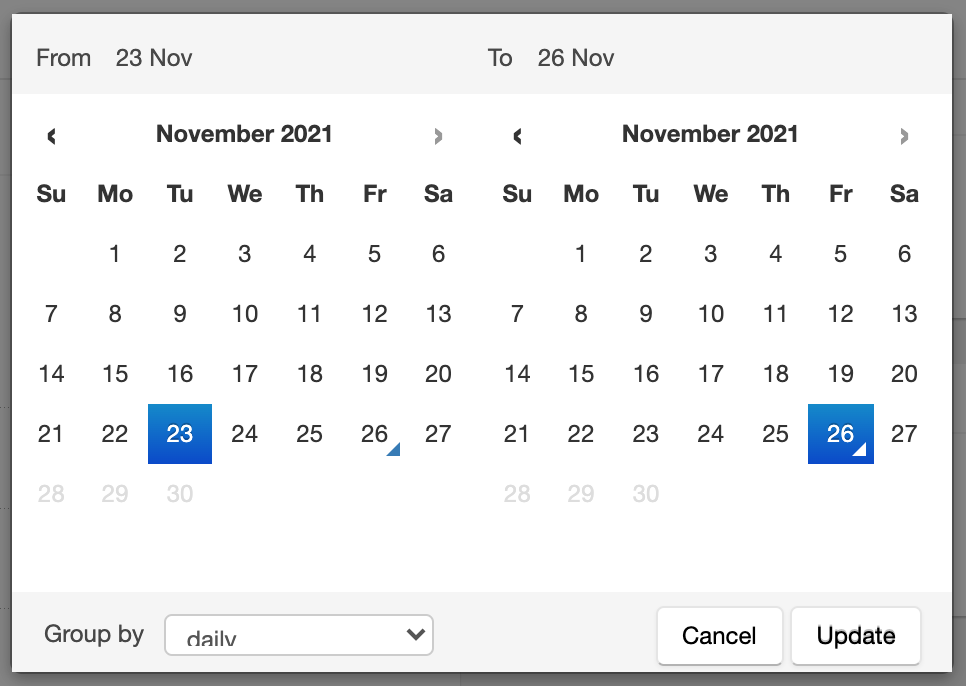
Select the start and end dates in the calendar view. You will be limited by the total range of data available in the system. If your date range does not go back far enough, contact support.

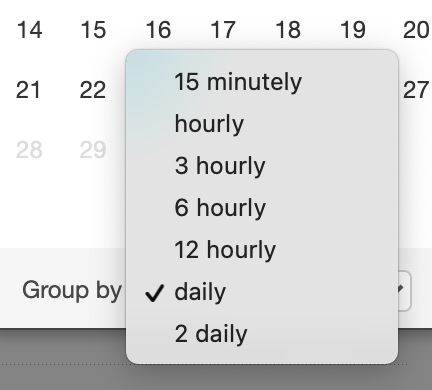
Select the resolution of your data and click update:

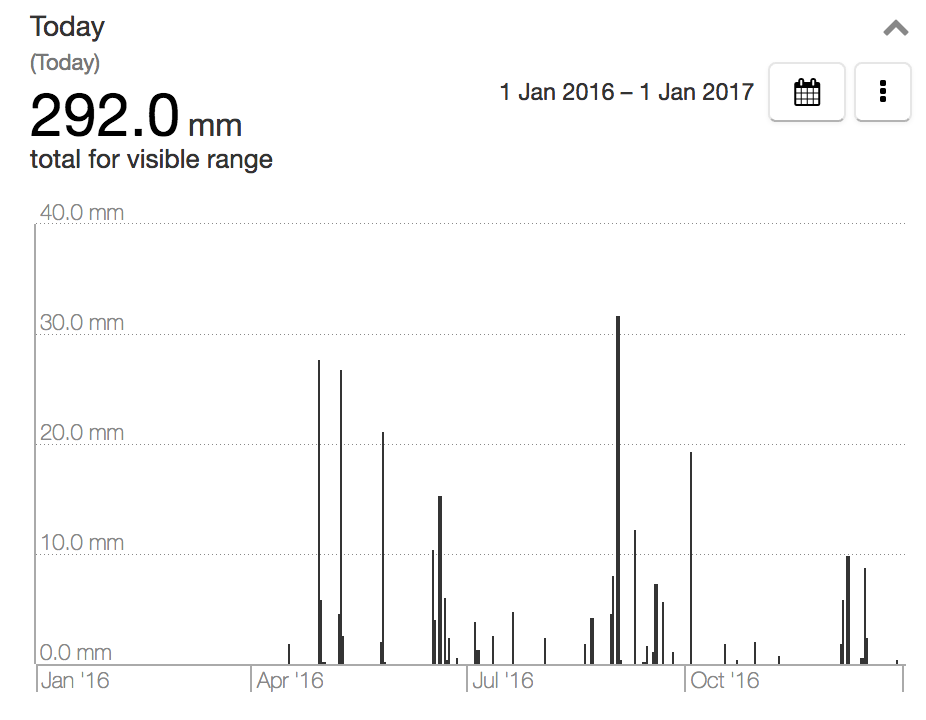
Once you hit the update button, you will see the total calculated for the date range you specified:

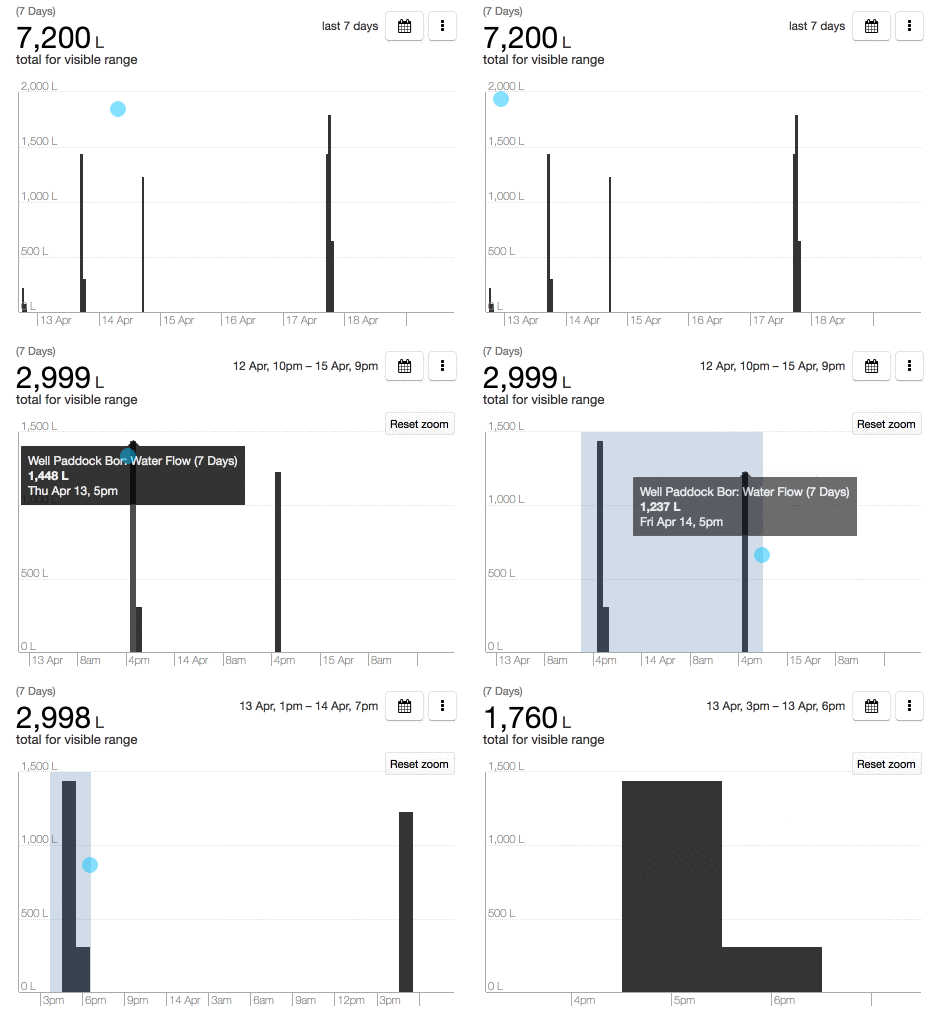
You can also see the total for any area you drag the mouse over
